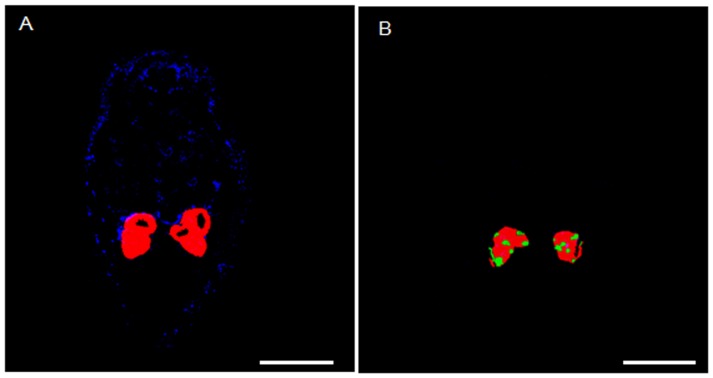
Figure 1. Whole-mount FISH analysis of the B. tabaci B nymphs used in this study.
(A) Overlay of Portiera and Rickettsia on dark field. (B) Overlay of Portiera and Hamiltonella on dark field. The epifluorescent images were generated artificially by combining two relevant monochrome images obtained with the same exposure time in the microscope. Red: Portiera; Blue: Rickettsia. Green: Hamiltonella. Bars = 100 µm.

