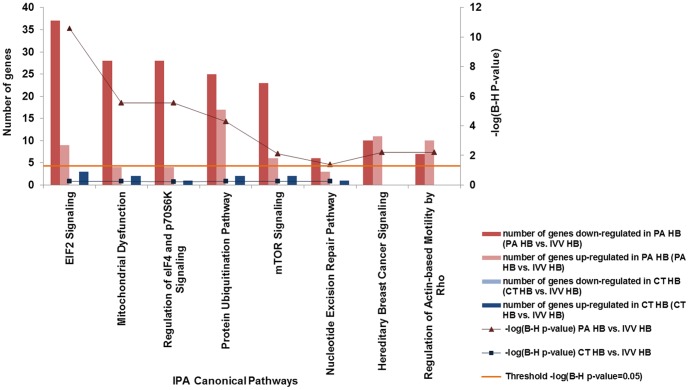
Figure 2. Altered canonical pathways in PA and CT-derived HB.
Bar chart shows the altered canonical pathways in IPA canonical pathways analysis. Major Y axis on the left shows the number of differentially expressed genes that involved in the canonical pathway. Secondary Y axis on the right shows the significance (-log (B-H P-value)) of the canonical pathway. The orange line shows the significance threshold cut off of -log (B-H P-value = 0.05).

