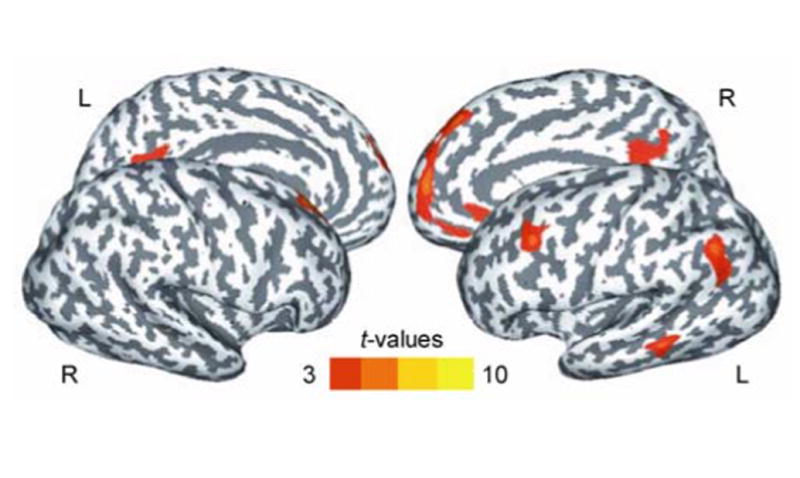
Figure 3.

Surface-based statistical maps of significant BOLD activation that was higher in the delayed internally-guided saccade condition compared to the delayed visually-guided saccade condition in the response period. Note: Dark gray color indicates sulci, light gray color indicates gyri; L, left hemisphere; R, right hemisphere; pcorrected = .05
