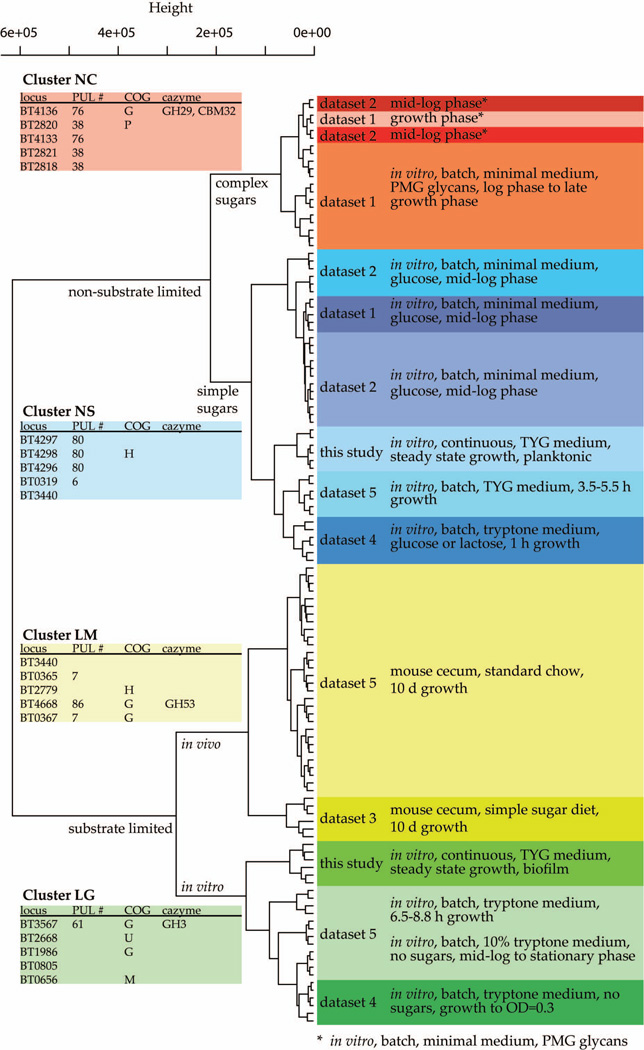
FIGURE 3. Hierarchical clustering of transcriptional profiles of B. thetaiotaomicron grown under different environmental conditions.
The analysis is based on genes that are differentially expressed between biofilm and planktonic samples. Their expression under other environmental conditions was used to perform the unsupervised clustering shown, using the hclust function in R. Color code: red labels, ‘non-limited with complex sugars’ (NC) cluster; blue, ‘non-limited with simple sugars’ (NS) cluster; yellow, ‘substrate limited grown in mouse’ (LM) cluster; green, the ‘substrate limited grown in glass or tube’ (LG) cluster. Labels on the right indicate the datasets, and essential information describing them. Tables on the left show loci and annotations for the five most discriminatory genes for each cluster. (PMG, porcine gastric mucin)

