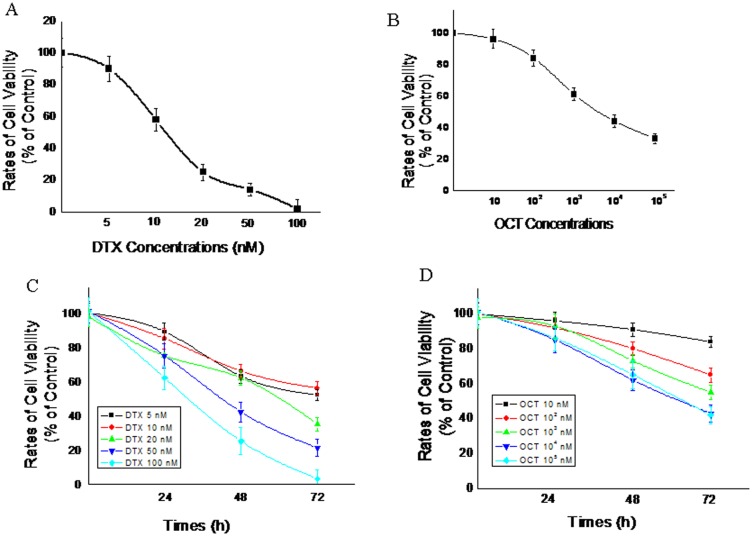
Figure 2. Inhibition of cell growth by different concentrations of DTX (A), OCT (B) after 72 hours incubation and in a time- and dose-dependent manner both of them respectively (C and D) on DU145 proliferation.
Cell viability was determined by MTT assay and expressed as a percentage of the control value (mean ± SEM of three experiments done in triplicate); error bars = SEM (n = 6).

