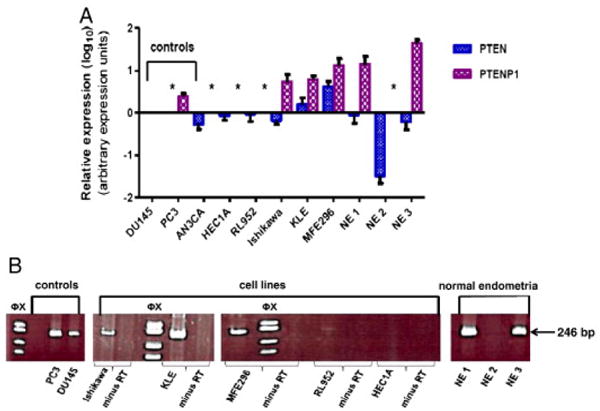
Fig. 1.

PTEN and PTENP1 expression in endometrial carcinoma cell lines and normal endometrium. A. Quantitative expression of PTEN and PTENP1. Log10-transformed averages of replicate experiments and standard errors of the mean are presented. Relative expression values are normalized to DU145 (prostate cancer cell line). *: PTEN or PTENP1 not expressed (exponential amplification cut off Ct ≥ 35). B. Representative RT-PCR analysis. PCR products (conventional RT-PCR 35 cycles) resolved on 10% polyacrylamide gels. The 246 bp PTENP1 PCR product is present in positive controls (DU145 and PC3 cell lines) and the Ishikawa, KLE, and MFE296 cell lines. Minus RT controls confirm that the PCR product is derived from the PTENP1 transcript. NE1 and NE3 samples are also positive for the 246 bp amplimer. Φx: Φx174 RF DNA/Hae III molecular size marker.
