
Fig. 2.
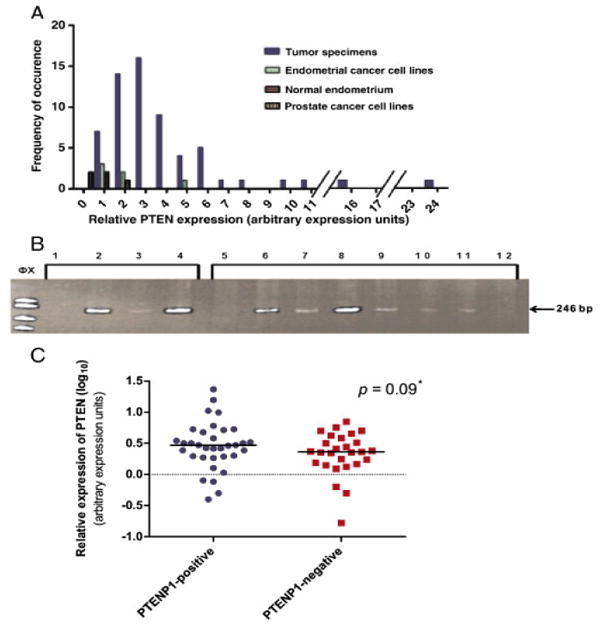
PTEN and PTENP1 expression in primary endometrial adenocarcinomas. A. Frequency distribution of average PTEN levels (expressed in arbitrary expression units) in primary tumors, normal endometria, and endometrial cancer cell lines. Relative expression normalized to DU145. Primary carcinomas show ∼ 135-fold range of expression. B. Representative RT-PCR PTENP1 expression analysis. The 246 bp PTENP1 PCR product is present in the positive control cell lines DU145, PC3 and Ishikawa (lanes 2–4) and in six primary tumors (lanes 6–11). The PTENP1 246 bp RT-PCR product is absent in two tumors that do not express PTENP1 (lanes 5 and 12). No template control is shown in lane 1. PCR products resolved on 10% polyacrylamide gels with Φx174 RF DNA/Hae III size standards. Variable intensity of the PCR product in positive controls and tumors may reflect differences in transcript levels. C. Relative PTEN expression in PTENP1- postivie and PTENP1-negative primary tumors. Graph of log10 transformed mean relative PTEN expression values of PTENP1-positive and PTENP1-negative tumors as assessed by real time PCR normalized to the DU145 cell line. Data points represent log10 transformed averages of three replicate experiments. Median PTEN levels for each group are indicated with horizontal bars. Dashed line: DU145 reference. *: Two tailed Mann–Whitney test.