
Fig. 3.
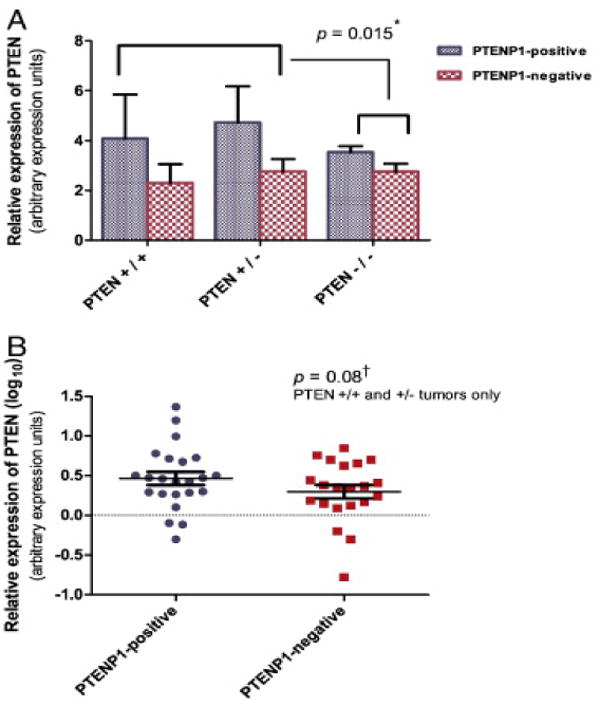
PTENP1 expression and PTEN transcript levels in primary tumors stratified by PTEN mutation status. A. Relative PTEN expression in PTEN wild type (+/+), haploinsufficient (+/−), and PTEN null (−/−) tumors. PTEN levels were more variable in PTEN wild-type (+/+) and haploinsufficient (+/−) tumors than in tumors with two mutations (−/−). *: Test for equality of variances. B. Log10-transformed averages of PTEN expression in wild-type (+/+) and haploinsufficient (+/−) PTENP1-positive and PTENP1-negative tumors are presented. Bars represent mean PTEN transcript values. Error bars represent standard errors of the mean. Dashed line: DU145 reference. †: One-tailed t-test.