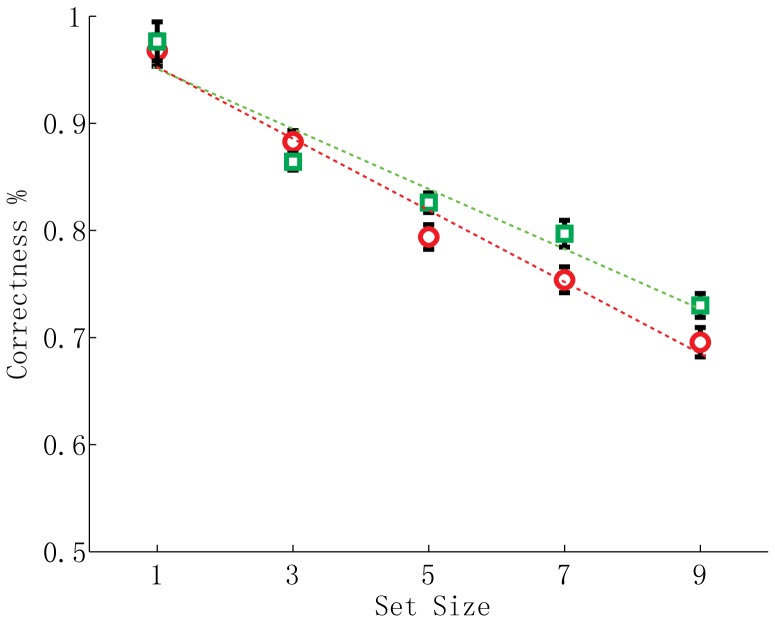
Figure 3. Percentages of correct responses of each set size condition in Experiment 1a (N = 29; red circles) and Experiment 2 (N = 21; green squares) and their linear regression curves.
The red curve is for Experiment 1a (slope = −0.034; R2 = 0.979; F(3, 1) = 139.227; p<.002) and the green curve for Experiment 2 (slope = −0.028; R2 = .941; F(3, 1) = 47.739; p<.007). Error bars are within-subjects SEs [64]. The slope of regression curve in Experiment 1a was not significant different from the slope of regression curve in Experiment 2 (Independent samples t-test; t(48) = −1.397; p = .169), suggesting the percentages of correct responses in both experiments obeyed a Weber’s law.

