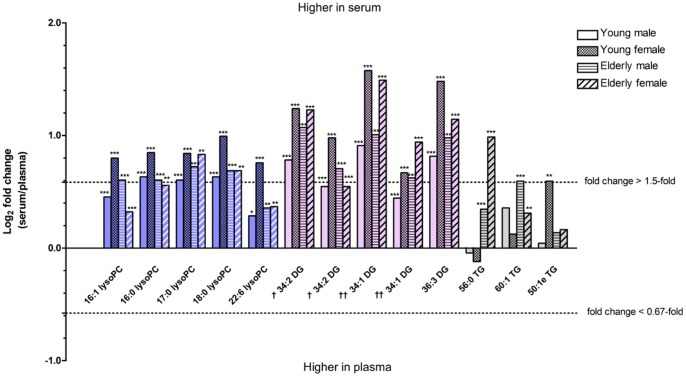
Figure 1. Differences in lipid metabolite levels in human blood samples between plasma and serum.
Lipid metabolites with marked fold changes (serum/plasma >1.5 or <0.67) and p<0.01 values between plasma and serum in any of the four subject groups are plotted for each group. Statistical significance was determined by Wilcoxon matched-pairs signed-rank test (*p<0.05, **p<0.01, ***p<0.001). Some metabolites (†, ††) with same exact mass were eluted with different retention time (Table S1) and therefore seem to be different molecular species of DG. LysoPC, lysophosphatidylcholine; DG, diacylglycerol; TG, triacylglycerol.

