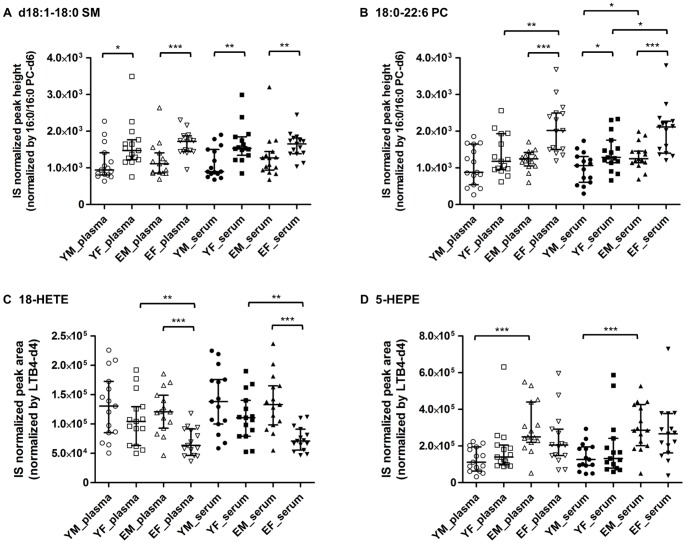
Figure 4. Levels of representative lipid metabolites with significant gender- and age-associated difference.
(A) d18∶1–18∶0 SM, (B) 18∶0–22∶6 PC, (C) 18-HETE, (D) 5-HEPE. The graph represents medians and interquartile ranges. Statistical significance was determined by Mann-Whitney U-test (*p<0.05, **p<0.01, ***p<0.001). YM, young male; YF, young female; EM, elderly male; EF, elderly female. SM, sphingomyelin; PC, phosphatidylcholine; HETE, hydroxyeicosatetraenoic acid; HEPE, hydroxyeicosapentaenoic acid.

