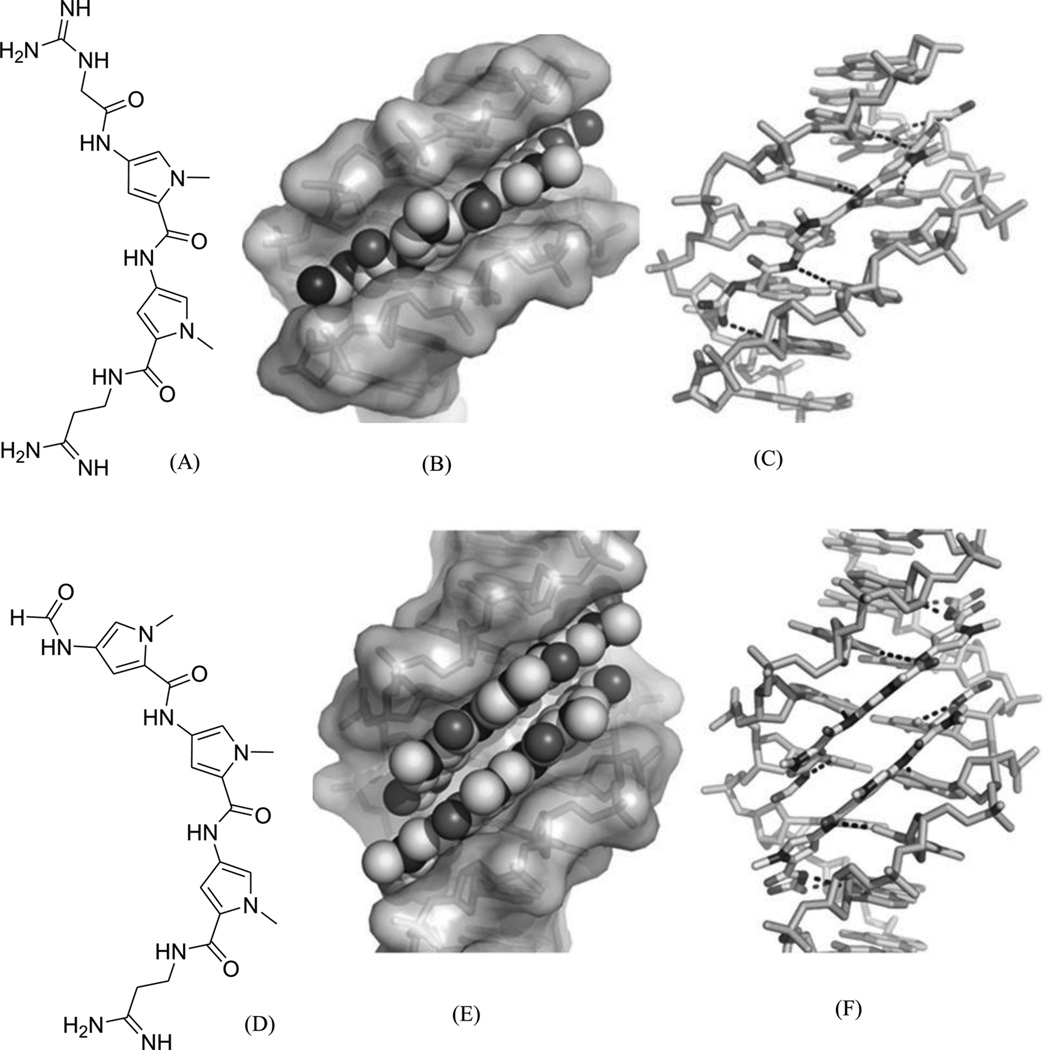
Figure 14.
(A) The chemical structure of netropsin (left) and its crystal structure in complex with DNA [5′-d(C5-BrCCCCIIIII)2-3′; PDB ID: 358D]. (B) The chemical structure of distamycin (left) and its crystal structure in complex with DNA [5′-d(GTATATAC)2-3′; PDB ID: 378D]. The structures are presented in two different formats to show the van der Waals interaction (middle) and hydrogen bonding (right, indicated by black dashed lines). Some H-bonds are obscured at the current view angle.

