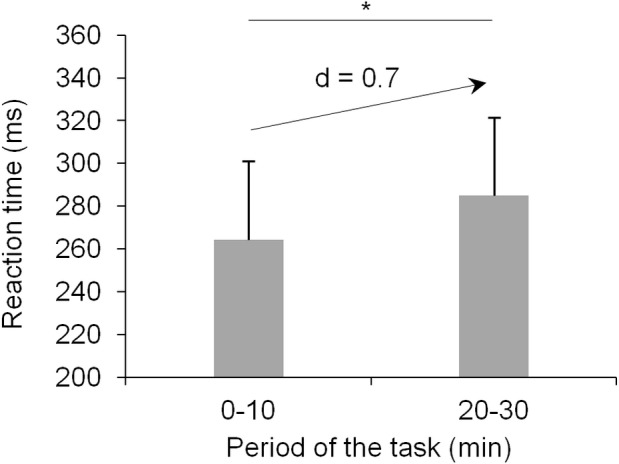
Figure 3. Changes in mean reaction time from the first ten to the last ten minutes of the task.

A significant increase in RT occurred at the end (last ten minutes) compared to the beginning (first ten minutes) of the task. Cohen’s effect size d value for this difference is specified above the centered arrow. *p<.05. Vertical bars represent SD.
