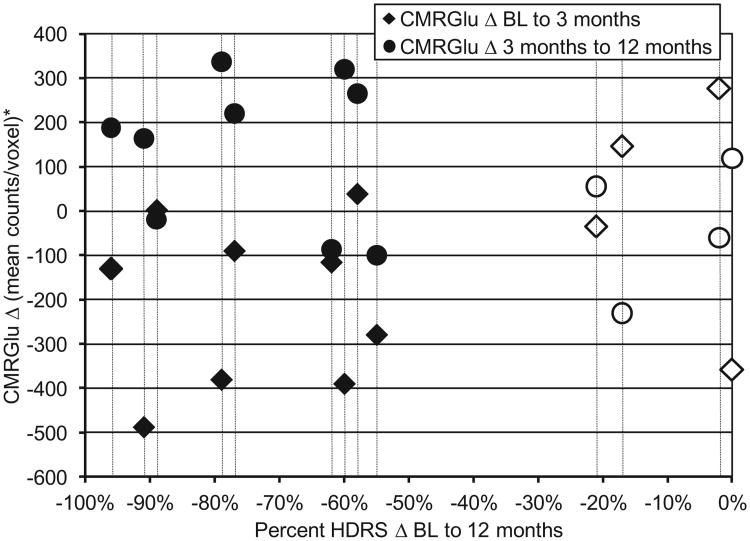
Figure 2.
Scatterplot depicting individual subject change in CMRGlu in the right DLPFC (baseline to 3 months = diamonds; 3–12 months = circles) versus percent change in Hamilton Depression Rating Scale score from baseline to 12 months. Vertical bars identify individual subjects. Solid markers = responders; open markers = nonresponders. Note the quadratic (v-shaped) change evident for 7/9 responders: decreased CMRGlu baseline to 3 months, increased CMRGlu 3–12 months; nonresponders demonstrated no consistent pattern of change. BL = baseline; CMRGlu = cerebral metabolic rate for glucose; HDRS = Hamilton Depression Rating Scale (24 item).

