
Figure 3.
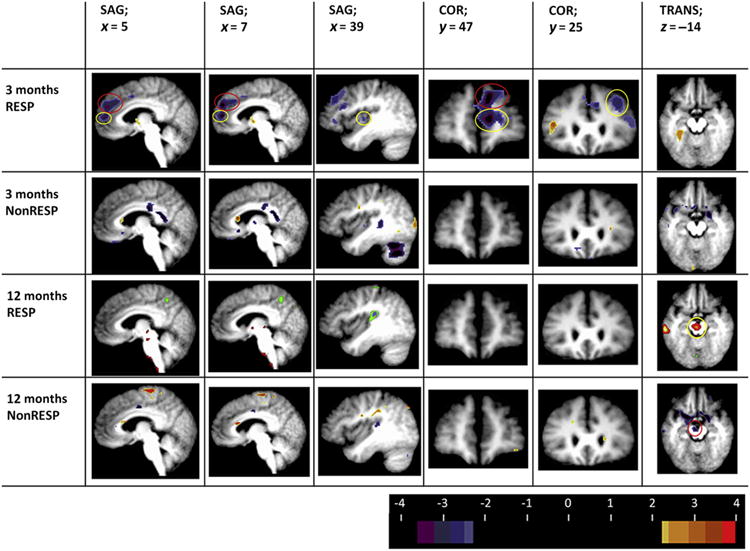
FDG-PET changes (responders vs. nonresponders; t statistic images; thresholdedat Puncorrected = 0.005, minimal cluster size 142 voxels) at 3 and 12 months. Columns 1 and 2 depict sagittal sections at Talairach slices x = 5 and 7. Note the right-sided decreased CMRGlu in the dorsomedial (BA 9; red circle) and rostral anterior cingulate cortex (BA 32; yellow circle) noted at 3 months in responders, but not in nonresponders. Further, these changes are not seen later in the course of VNS (12 months). Column 3 depicts a sagittal section at Talairach slice x = 39. Note the 3 month decrease in right posterior insular/superior temporal CMRGlu (yellow circle) in responders. Column 4 depicts a coronal sections at Talairach slice y = 47. Note the decreased CMRGLu in the rostral anterior cingulate (BA32, yellow circle) and dorsomedial and dorsolateral PFC (column 5; BA9; red circle) in responders only at 3 months VNS. Column 5 depicts a coronal section at Talairach slice y = 25. Note the decreased CMRGlu in the dorsolateral PFC(BA9; yellow circle) at 3 months in VNS responders only. Column 6 depicts a transverse section at Talairach slice z = −14. Note the increased CMRGlu in the left substantia nigra (VTA; yellow circle) at 12 months in the VNS responders; conversely, a decrease in CMRGlu is observed in nonresponders at 12 months in VNS nonresponders (red circle). All images in neurological format (viewer right/left = subject right/left). Although changes in the responders-only group did reach our established threshold, the small sample size (N = 4) of VNS nonresponders prohibits making conclusive determinations. Abbreviations: COR = coronal; SAG = sagittal; TRANS = transverse; RESP = VNS responder at 12 months; NonRESP = VNS nonresponder at 12 months. Images are thresholded at t = 2.7 for pattern illustrative purposes (t = 3.8 for statistical significance). (For interpretation of the references to color in this figure legend, the reader is referred to the web version of this article.)