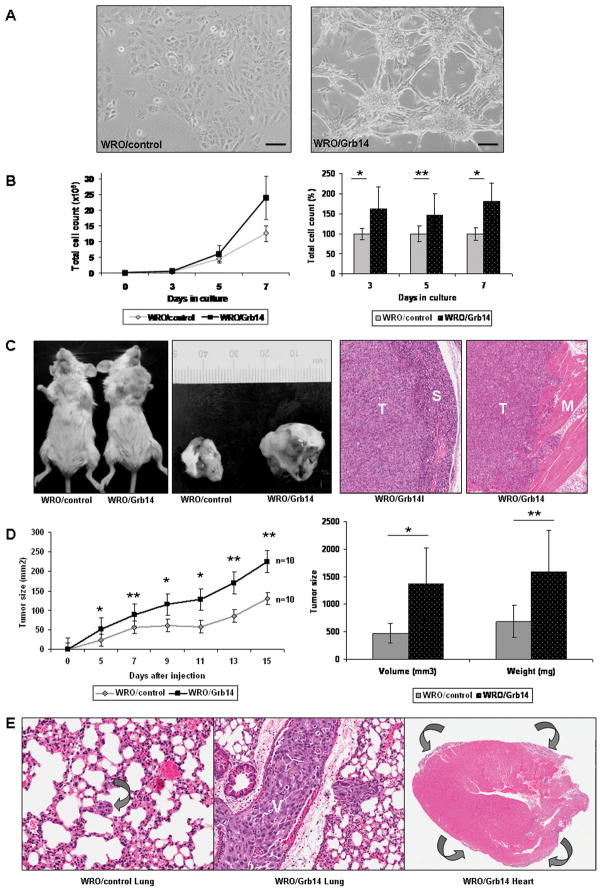
Figure 5. Grb14 over-expression promotes thyroid cancer cell growth in vitro and in vivo.
A. Forced Grb14 over-expression accentuates thyroid cancer cell architecture, as shown in phase contrast photomicrographs. B. The impact of Grb14 over-expression on cell proliferation is shown in a representative growth curve (left); a summary of two independent proliferation assays depicts the significant difference between control (WRO/control) and Grb14 over-expressing (WRO/Grb14) cells as indicated. Proliferation rate was determined every day as a percentage of the average of controls. The * symbol denotes a highly significant Mann-Whitney test (p<0.000001); ** significant with Mann-Whitney test (p=0.0325). C. An orthotopic mouse xenograft model demonstrates the rapid progression of disease in mice inoculated with Grb14 over-expressing cells compared to their controls. Tumors over-expressing Grb14 (T) infiltrate into surrounding structures including salivary gland (S) and skeletal muscle (M) (hematoxylin-eosin stain). D. The growth curve displays the significantly faster growing tumors in Grb14 over-expressing clones compared to empty vector controls. The differences between tumor xenografted tissues shows larger volumes and greater weights in the Grb14 over-expressing group compared to empty vector clones. The * symbol denotes highly significant differences (p<0.001 at days 5, 9, 11 and tumor volume at sacrificing); ** denotes significance (p<0.01 at days 7, 13, 15, and tumor weights at sacrificing) with Mann-Whitney test. E. At autopsy, the lungs of animals bearing control cells exhibited small foci of metastatic carcinoma (left, arrow) whereas those with tumors over-expressing Grb14 (middle) had huge metastatic deposits with tumor thrombi in vessels (V) and metastatic malignant pericardial disease surrounding the entire heart (right, arrows), a feature that was not seen in any other animals. (Hematoxylin-eosin staining).

