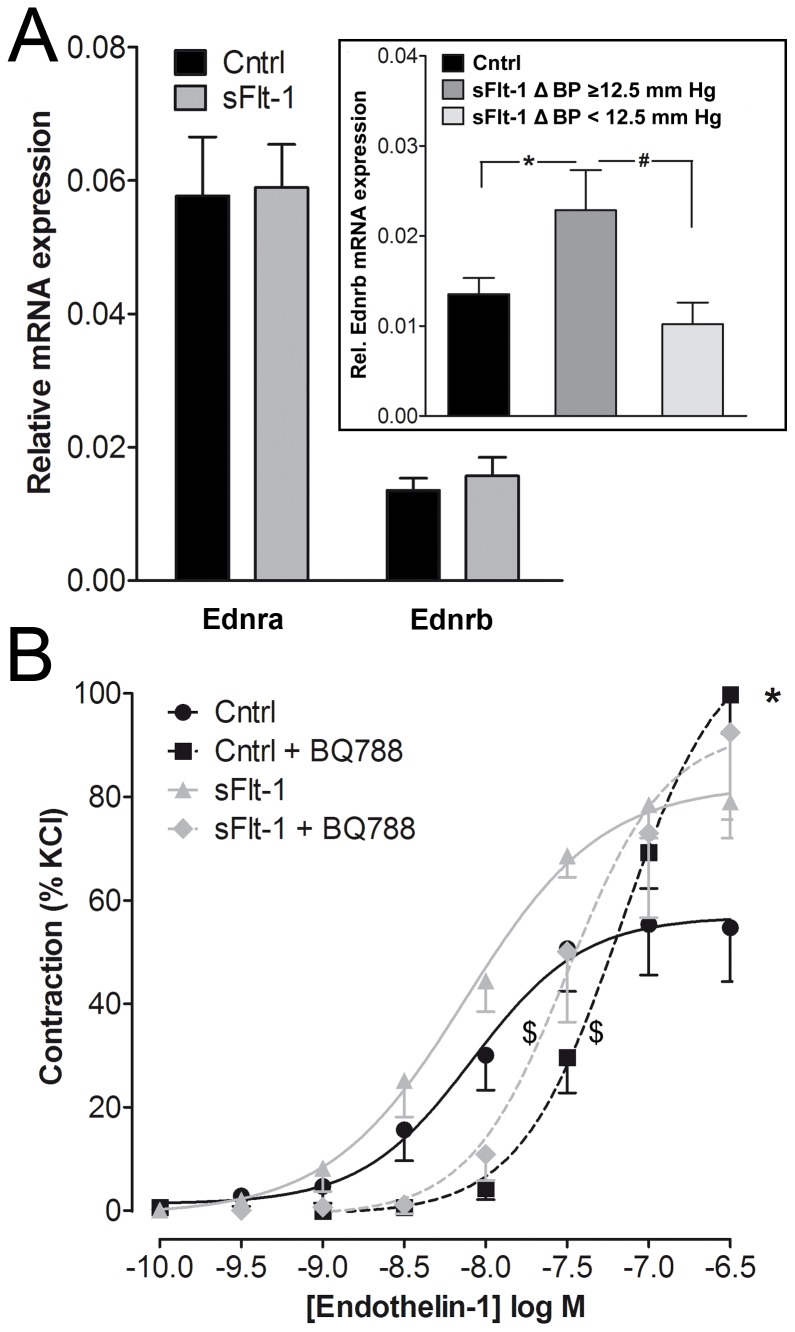
Figure 4. mRNA expression of ETA and ETB receptors and effect ETB receptor blockade.
A) Quantitative Real-Time PCR showing thoracic aorta mRNA expression profiles of Ednra and Ednrb in vehicle (Cntrl) and sFlt-1-treated mice normalized to Hprt mRNA levels. Data expressed as mean±SEM, *(Inset figure shows a two-fold increase in high-responders vs. Cntrl, N = 7–13, p<0.05), #(high-responders vs. low-responders, N = 7–5, p = 0.06). B) Effect of pre-incubation with the ETB receptor antagonist BQ788 on endothelin-1 concentration-response curves of carotid segments isolated from vehicle (Cntrl, N = 5) and sFlt-1-treated mice (N = 4). *(maximal efficacy of Cntrl vs. Cntrl + BQ788, N = 5–9, p<0.05), $(EC50 of sFlt-1 vs. sFlt-1 + BQ788 and Cntrl vs. Cntrl + BQ788, p<0.05)

