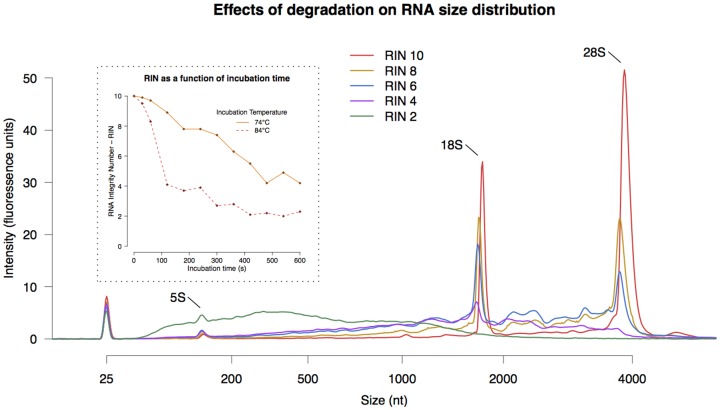
Figure 2. Effects of degradation on the RNA size distribution for different RINs.
The large ribosomal RNA peaks, 18S and 28S, show a steady decrease with decreasing RIN and completely disappear for RIN 2. Also apparent is an increase of small molecules with decreasing RIN. This is especially noticable for the RIN 2 sample. The dotted inset shows how the magnesium ions affect the RIN of the RNA as a function of temperature and incubation time.

