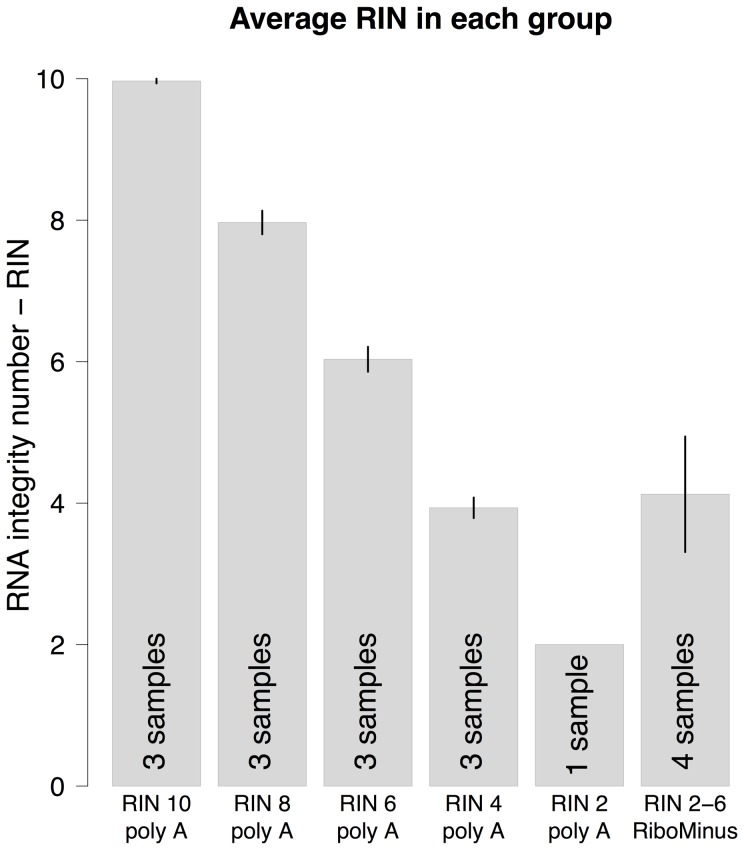
Figure 3. Attributes of the experimental groups.
The height of the bars represents the average RIN for each group along with error bars. The bottom of each bar shows the number of samples in each group. Below each bar are the group names which both show the average RIN as well as the enrichment method used for the samples in the groups. Error bars denote the standard error. One of the RIN 8 samples failed in library preparation thus for the subsequent sequencing data there are only two samples in the RIN 8 group.

