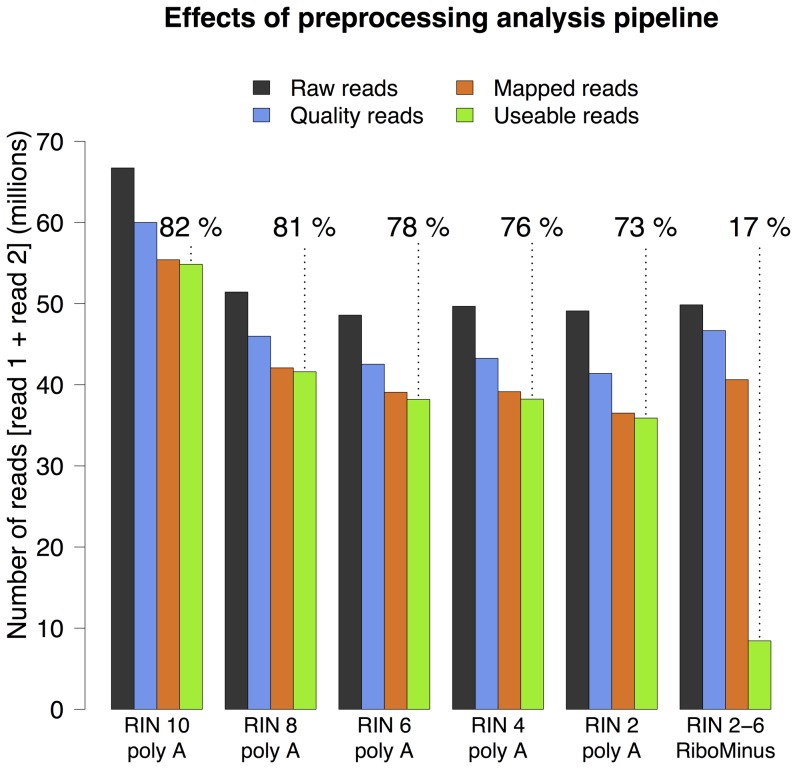
Figure 4. Preprocessing of sequencing data.
The barplot shows how many reads survive through each of the steps of the preprocessing pipline (see Methods). The step of going from Mapped reads to Useable reads is removal of rRNA. A large amount of reads are lost due to rRNA read removal in the RiboMinus group. The pecentage of useable reads (shown above the dotted lines) shows a steady decline with decreasing RIN. The poor performance of the RiboMinus samples can be attributed to high rRNA contamination.

