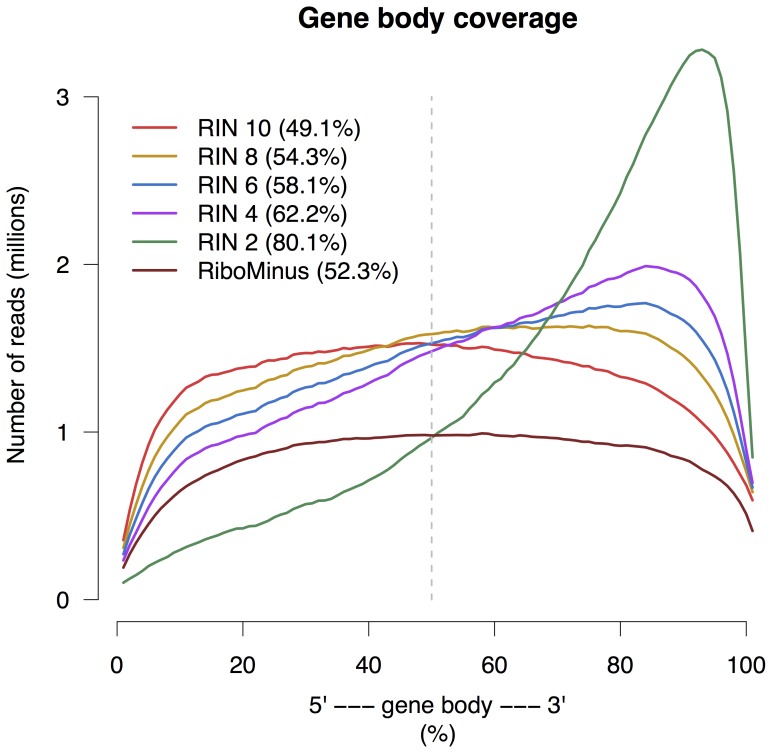
Figure 5. Gene body coverage on average for each group.
Both RIN 10 and RiboMinus show even coverage. The percentages in the paranthesis show the relative amount of reads that map closer to the 3' end than to the 5' end, i.e. the amount of reads that map to the right of the dashed vertical line. Each step of decreasing RIN shows an increase in 3' bias.

