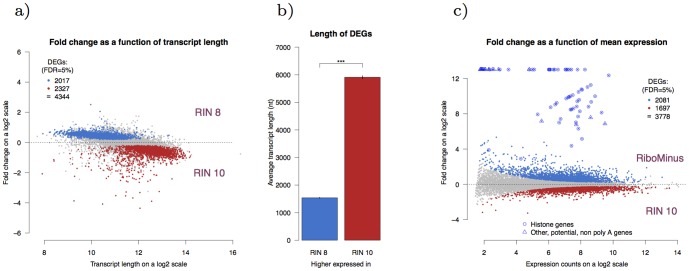
Figure 6. Differential expression of degraded RNA.
(a) A common feature of the differential expression profiles is that long transcripts tend to be more highly expressed in the group with higher RIN and, reversely, short transcripts tend to be more highly expressed in the group with lower RIN. Shown here is the expression profile for the comparison RIN 10 vs. RIN 8, with log of the fold change (fold change = expr(RIN 8)/expr(RIN 10)) on the y-axis and transcript length on the x-axis. (b) The DEGs shown in (a) are split into two groups; the ones that have higher expression in RIN 10 (red) and the ones that have higher expression in RIN 8 (blue). The average transcript length in the RIN 10 group is significantly higher than the average transcript length in the RIN 8 group (Student's t-test, p
 0.001). Error bars denote the standard error. The distribution of these gene lengths is shown in Figure S6. (c) Expression profile of the comparison RIN 10 vs. RiboMinus. In total there are 3778 DEGs; with 2081 upregulated in the RM group and 1697 upregulated in the RIN 10 group. Some of the genes upregulated in the RM group show markedly high fold change. Many of those, marked with a circle, are histone genes. The transcripts of histone genes lack a poly A tail which explains why they show a markedly higher expression in the samples prepared with ribosomal depletion compared to samples prepared with poly A selection. Additionally, genes that show similar trend have been marked with a triangle. These data indicate that those genes may lack or have repressed poly adenylation sites.

