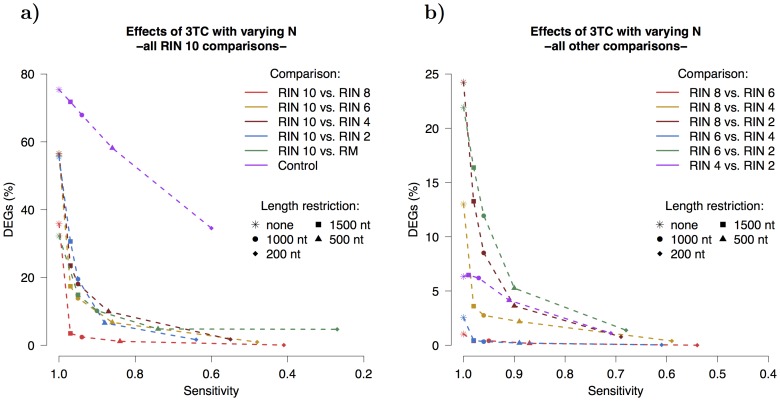
Figure 8. Effects of 3TC method on differential expression.
The y-axis shows the percentage of DEGs and the x-axis shows the sensitivity. The colors denote different comparisons while different shapes of points denote the varying N used in the length restriction process. (a) All RIN 10 comparisons. All comparisons demonstrate a sharp decrease in DEGs going from no length restriction to N = 1500 nt. Lowering N further results in fewer DEGs but at the expense of sensitivity. The control, which compares two different cell lines, does not show any abrupt decrease in DEGs but rather follows a straight line. (b) All non-RIN10 comparisons. All comparisons, except RIN 4 vs. RIN 2, show improvement with the 3TC (N = 1500) method. This is even true for the two comparisons, RIN 8 vs. RIN 6 and RIN 6 vs. RIN 4, where originally there were very few DEGs. [DEGs = differentially expressed genes].

