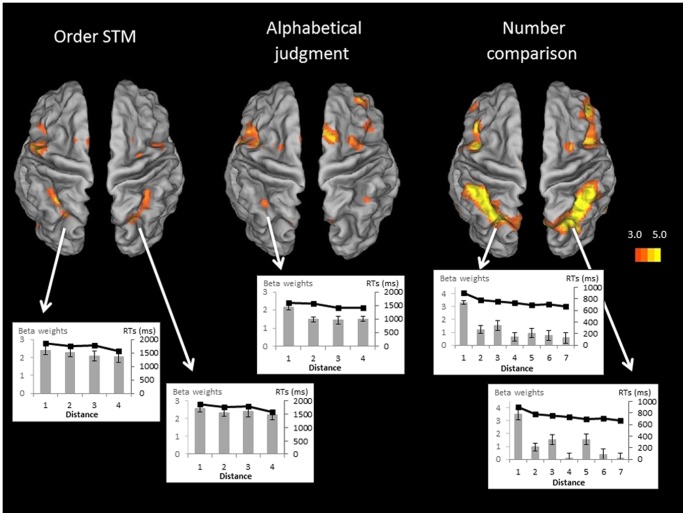
Figure 4. Brain to the distance effect in order STM, alphabetical judgment and number comparison conditions.
Regions are shown with a display threshold of 3≤ Z ><5. The results are mapped onto an inflated brain template using Caret 5.64 with the PALS-B12 atlas [63], [64]. Brain areas presenting a strictly monotonic decrease of percentage activation (grey columns) with positional/alphabetical distance (p<.001, uncorrected) similar to the pattern of reaction times (black curve). Data are averaged across conditions.

