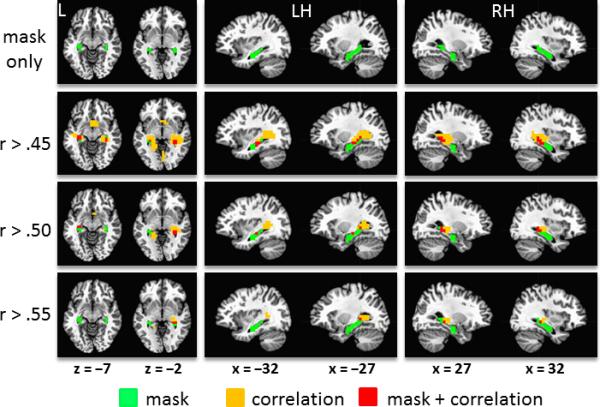
Figure 3.

Volumetric distribution of correlation coefficients for fast gamma activity (80-140 Hz) during awake rest and within-session spatial learning rate. The resampled bilateral hippocampal mask (in green) is overlayed on a standardized brain template (top row). The correlation data are also overlayed on a standardized brain template and thresholded at Pearson's r > .45, .50 and .55. (bottom rows). Red voxels are those that contain correlation coefficients that exceed the threshold and are included in the anatomical masks. Orange voxels also contain correlation coefficients that exceed the threshold but are not included in the masks. Images are in neurological orientation (left = left). L = left, LH = left hemisphere, RH = right hemisphere.
