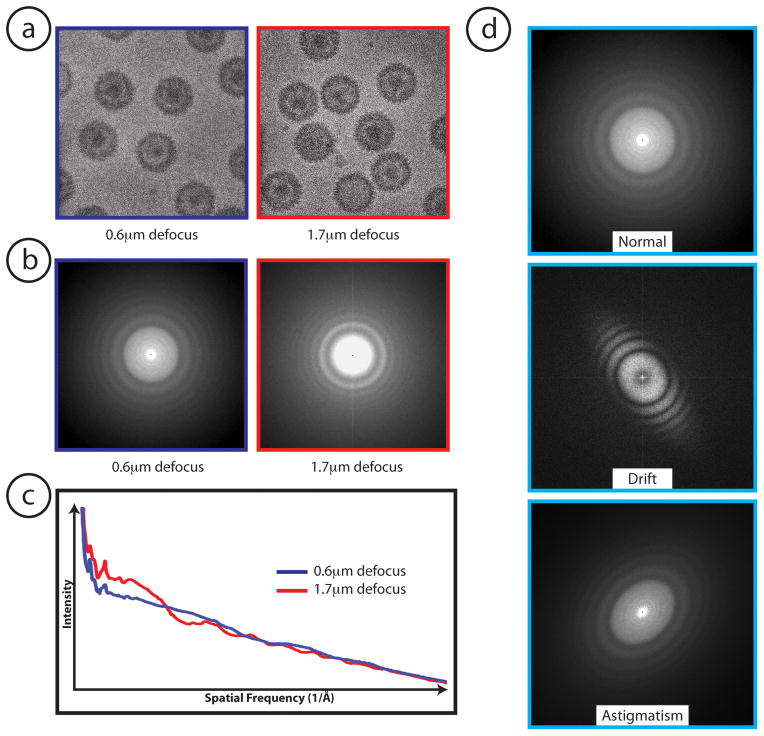
Figure 2.
Image pre-processing and data assessment. (a) Typical electron micrographs of herpes simplex virus type I collected on a 300kV electron cryomicrosope. Higher contrast (right side of figure 2a) as a result of defocus is visible in the real space images. (b) Differences in defocus are also visualized in Fourier space, where images further from focus have tighter Thon rings. (c) Power spectrum curves from boxed herpes particles at different defocuses, which can be used to fit contrast transfer function (CTF) curves of the corresponding micrographs (d) Comparison between a normal image and images with aberrations (e.g. drift, astigmatism). For the purposes of quality control, images that contain these aberrations are typically excluded prior to processing the data for a 3-D reconstruction.

