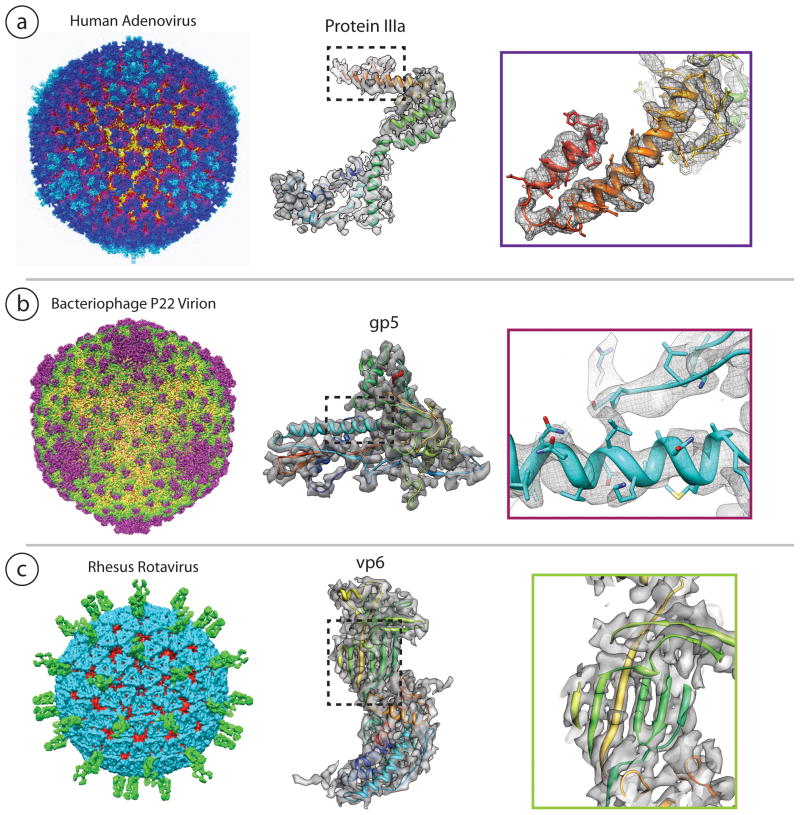
Figure 5.
Selected near-atomic resolution cryo-EM density maps. The left column of the figure is the whole virus density map, the middle is the segmented subunit density map of the virus, and the right column is a close-up that shows their detailed features. (a) Human Adenovirus [EMD-5172]. The Protein IIIa density shows more connecting density than the X-ray density map. (b) Bacteriophage P22 [EMD-1826]. Individual bulky side chains are visible in the gp5 subunit of P22. (c) Rotavirus [EMD-5199]. At near atomic resolution, the separations of beta strands in VP6 [EMD-1461] can be clearly seen.

