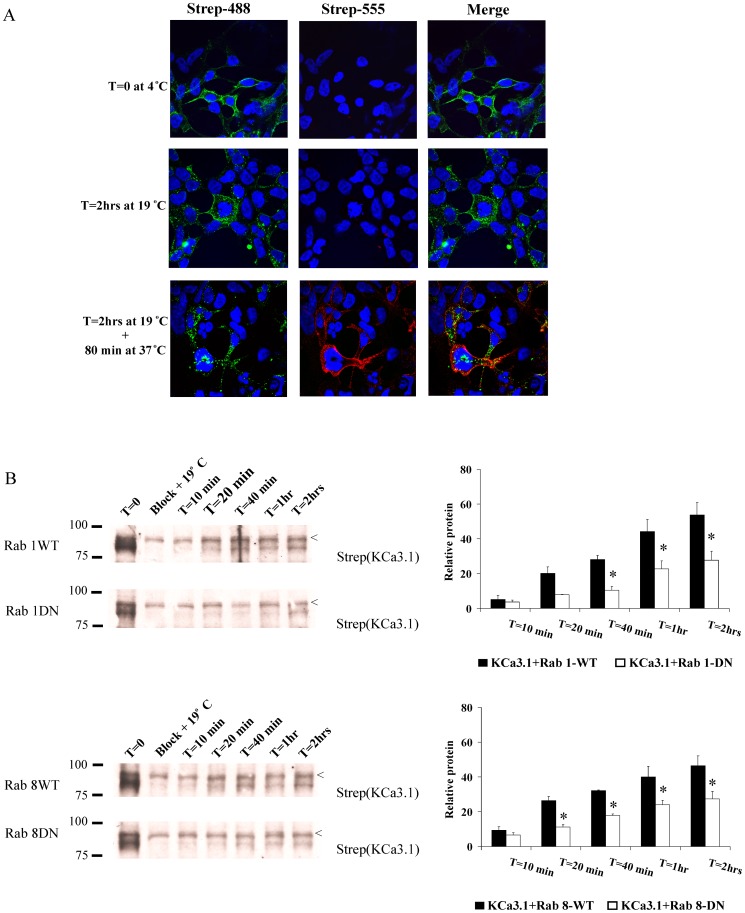
Figure 6. DN Rab1 and Rab8 slow ER/Golgi-to-plasma membrane delivery of KCa3.1.
A. IF illustration of plasma membrane BLAP-KCa3.1 blocking protocol and subsequent appearance of new BLAP-KCa3.1 to the plasma membrane along the biosynthetic pathway. HEK293 cells were transfected with BLAP-KCa3.1 and BirA-KDEL in the pBudCE4.1 plasmid such that BLAP-KCa3.1 is specifically biotinylated at the level of the ER (see Methods). Top row: Plasma membrane BLAP-KCa3.1 was labeled with strepatavidin-Alexa488 (left; green) and subsequently with streptavidin-Alexa555 (middle; red). As is apparent, strep-488 saturated the biotin binding sites, precluding strep-555 labeling; demonstrating block of existing plasma membrane localized KCa3.1 channels. Middle row: Following 2 hrs at 19°C to accumulate KCa3.1 in the Golgi, some of the channels initially labeled at the plasma membrane (strep-488) have been endocytosed. Labeling with strep-555 demonstrates that no new channels have trafficked to the plasma membrane during this 19°C incubation, as expected. Bottom row: Further incubation at 37°C for 80 min results in endocytosis of KCa3.1 channels initially labeled with strep-488 at T = 0. Labeling with strep-555 demonstrates that new KCa3.1 channels have appeared at the plasma membrane, consistent with trafficking out of the Golgi. Nuclei are labeled with DAPI (blue). B. Experiments were carried out as illustrated in A except that blocking of existing plasma membrane KCa3.1 was carried out using neutravidin. As shown in lane 2 for each blot, neutravidin eliminated greater than 90% of the labeling attributed to streptavidin binding to plasma membrane BLAP-KCa3.1. Within 10 min incubation at 37°C, KCa3.1 begins to appear at the plasma membrane following ER/Golgi exit. After 2 hrs, KCa3.1 has recovered ∼50% relative to T = 0 in the presence of WT Rab1 and Rab8, whereas this is decreased to ∼27% in the presence of DN Rab1 and Rab8. 30 μg of protein was loaded per lane. The average of 3 experiments is shown in the bar graphs. The solid bars indicate expression of KCa3.1 in the presence of WT Rab while the open bars show expression of KCa3.1 in the presence of DN Rab (* P<0.05 with respect to same period of time with WT Rab). “<” indicates a non-specific band. These results indicate that DN Rab1 and Rab8 slow exit of KCa3.1 from the ER/Golgi resulting in decreased plasma membrane expression as suggested in Fig. 4.

