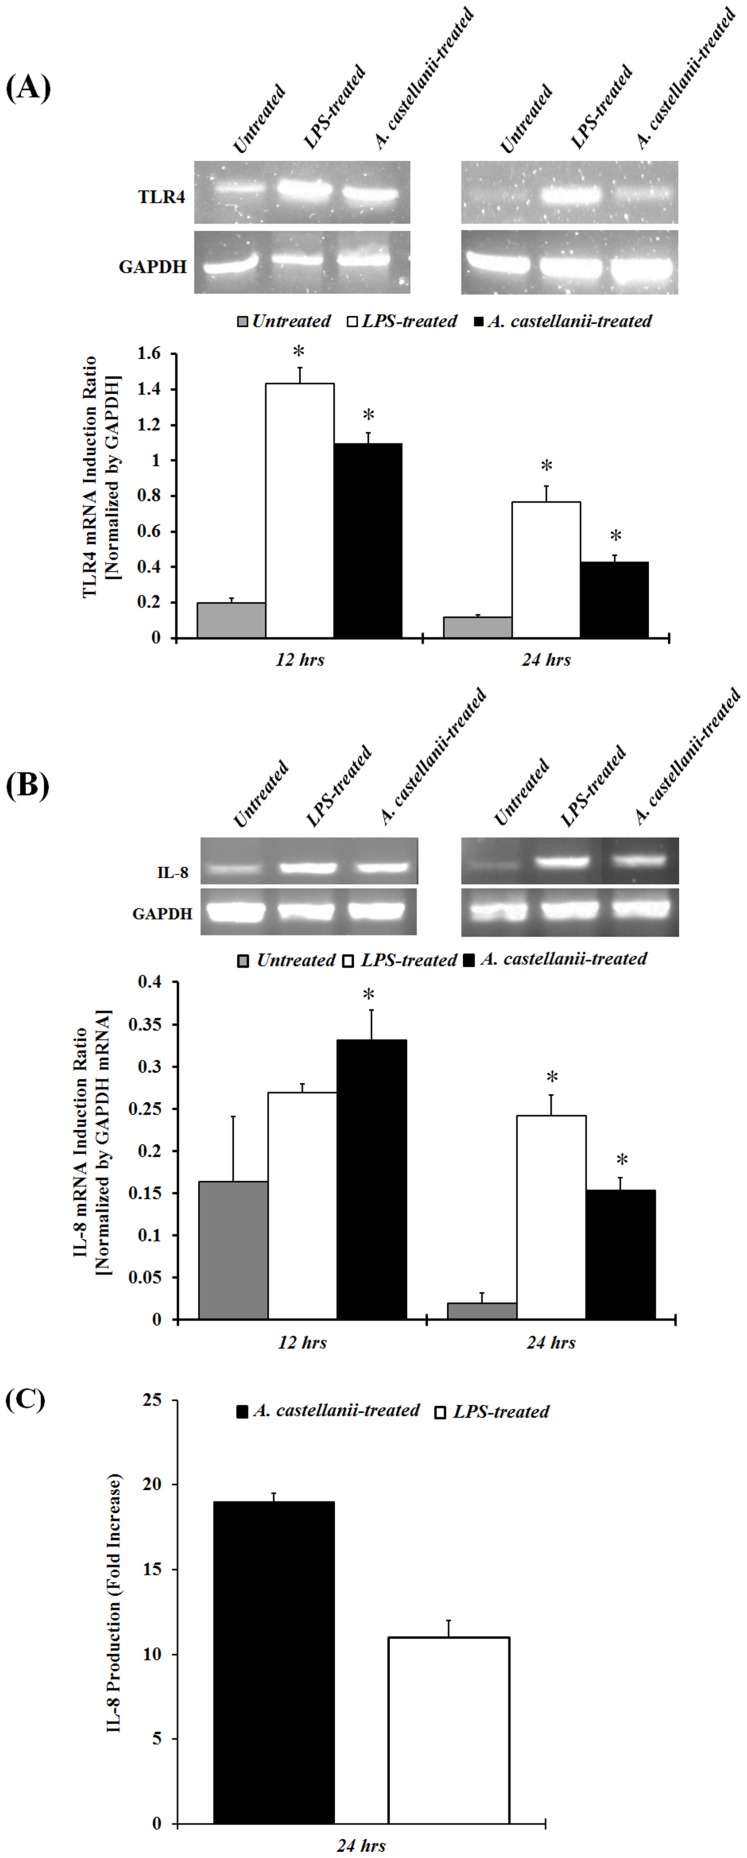
Figure 2. Effect of A. castellanii trophozoites on TLR4 and IL-8 mRNA, and IL-8 protein expression in HCE cells.
HCE cells were stimulated with A. castellanii (1×10⁵ cells/ml) and LPS (10 μg/ml) for 12 and 24 hours, and were then processed for total RNA isolation and RT-PCR analysis for TLR4 and IL-8 mRNA expression. The amount of mRNA expression was quantified by densitometry of bands in comparison to Glyceraldehyde-3-phosphate dehydrogenase (GAPDH). Densitometry of mRNA bands were quantified by three independent scanned presented as mean±SEM (2A and 2B). HCE cells were stimulated with A. castellanii (1×10⁵ cells/ml) and LPS (10 μg/ml) 24 hours. Supernatants were collected from harvested cells and subjected to IL-8 specific ELISA (2C). The data are mean±SEM of three independent experiments. Asterisk indicates P value < 0.05 by unpaired Student’s t-test.

