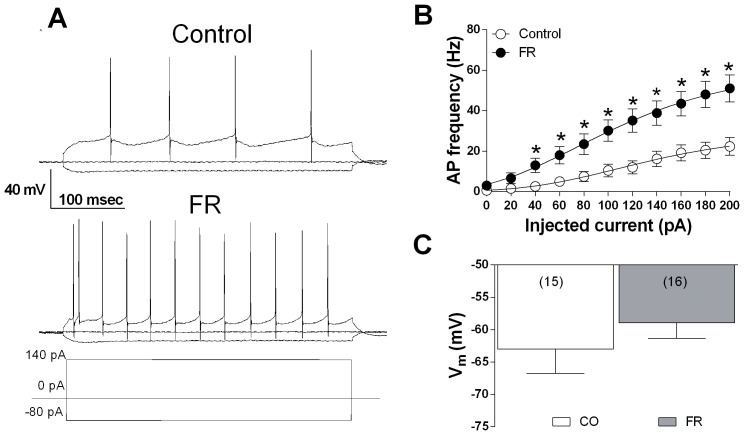
Figure 7. Changes in mPFC pyramidal neuron excitability in FR rats.
(A) Representative membrane voltage responses to 400 msec of negative (−80 pA) and positive (140 pA) current pulses applied to single mPFC pyramidal neurons of control and FD rats (sacrifice 5 min before food consumption). (B) Scatter plot representing the quantitative effect of increasing depolarizing current steps on APs frequency in mPFC neurons of rats fed ad libitum and FR animals. a P<0.0001, two-way ANOVA. Data are expressed as means ± SEM and were obtained from 8 animals, and included 15 cells from rats fed ad libitum, and 16 cells from FR animals. (C) Bar graph representing the resting membrane potential of mPFC principal neurons, for the indicated numbers of cells, from fed ad libitum and FR rats.

