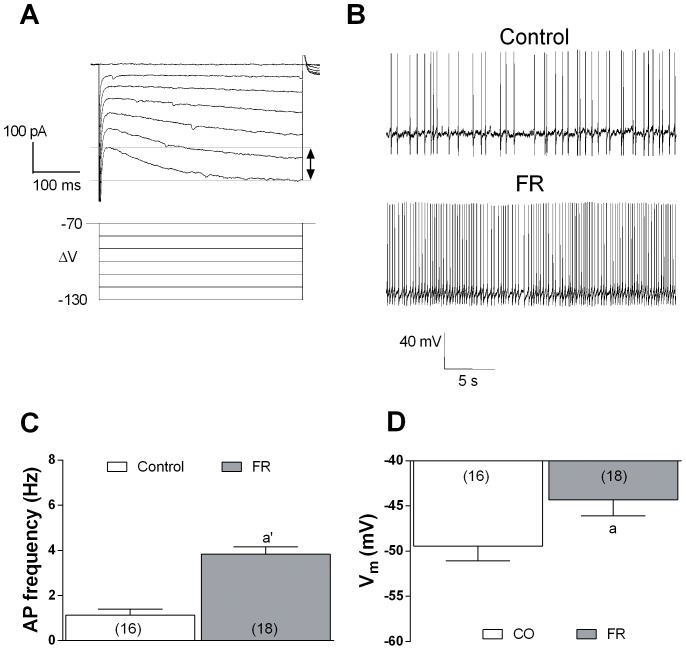
Figure 8. Changes in VTA dopaminergic neurons excitability in FR rats.
(A) Dopaminergic neurons show a typical Ih current when the membrane is hyperpolarized starting from −100 mV. (B) Representative traces of spontaneous AP firing recorded from single VTA dopaminergic neuron from fed ad libitum and FR rats (sacrificed 5 min before food consumption). (C) Bar graph representing the quantitative effect of FR on spontaneous AP firing recorded in VTA dopaminergic neurons. a P<0.0001 vs rats fed ad libitum, unpaired t-Test. Data are calculated from 8 animals, including 16 cells from rats fed ad libitum, and 18 cells from FR animals. (D) Bar graph representing the resting membrane potential of VTA dopaminergic neurons, for the indicated numbers of cells, from fed ad libitum and FR rats. a P<0.05 versus fed ad libitum, unpaired t-Test.

