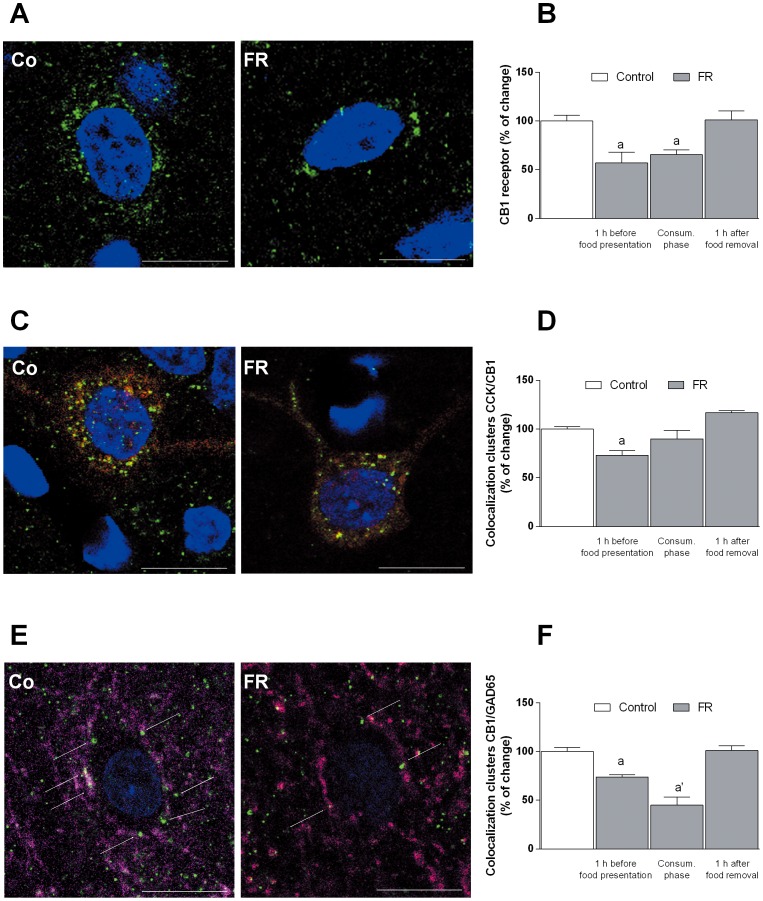
Figure 11. Effect of food restriction on the amount of CB1 receptors in mPFC.
(A) Confocal images of CB1 receptor (green, nuclei blue); (B) Semiquantitative determination of the abundance of CB1 receptor, evaluated by image analysis of the immunohistochemistry, in mPFC of rat exposed to food restriction during anticipatory and consummatory phase with respect to fed ad libitum animals. (C) Confocal images of CB1 receptor (green) localization in CCK positive neurons (red, nuclei blue); (D) Semiquantitative determination of the abundance of the colocalization CCK/CB1 receptor, determined by image analysis of the immunohistochemistry data, in FR and fed ad libitum animals. (E) colocalization of GAD65/CB1 cluster (CB1 receptors green; GAD65 fuchsia, nuclei blue). (F) Semiquantitative determination of the abundance of the cluster GAD65/CB1 receptor as determined by image analysis of the immunohistochemistry data. Results are expressed as percentage of change in cluster numbers relative to fed ad libitum rats and are mean ± SEM of values of 5 rats for each experimental group. a P<0.005; a’ P<0.001 versus fed ad libitum rats, one way ANOVA; image scale bar 10 µm.

