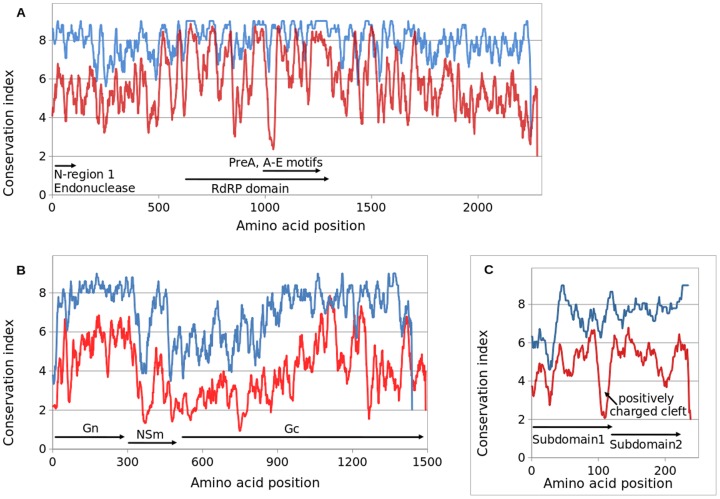
Figure 2. Analyses of protein conservation for (A) L protein, (B) M polyprotein precursor and (C) N protein.
Protein sequences were aligned by the PROMALS server. The conservation index numbers (0–9 for the lowest to the highest) were averaged with a window size of 15 amino acids and then plotted to show amino acid conservation and variability. Blue curves, all nine group C viruses sequenced in this study. Red curves, the group C viruses and orthobunyaviruses of other serogroups (reference sequences in GenBank). Relative positions for Gn, NSm and Gc proteins on M segment and structural domains on L and S segment were indicated with the arrowed bars.

