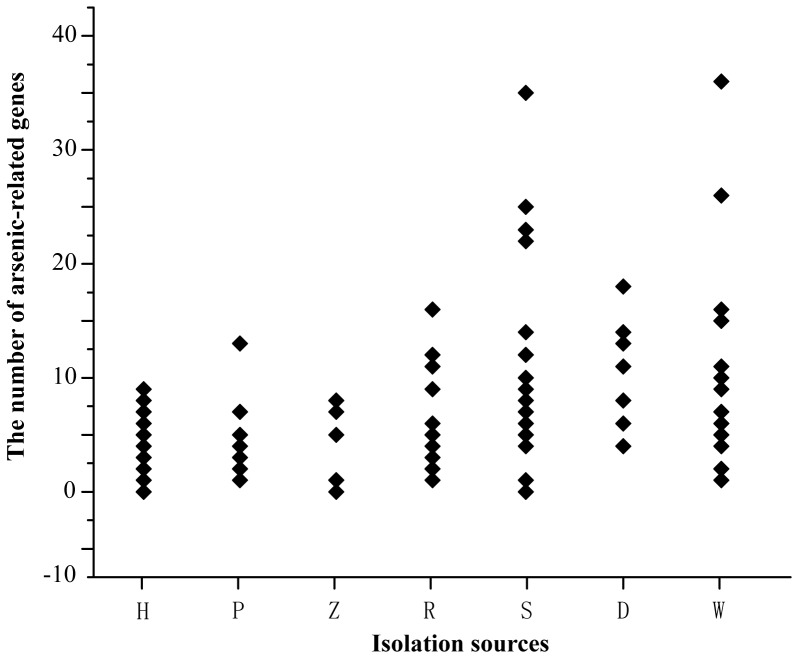
Figure 6. Habitat impacts the distribution of arsenic-related genes in Burkholderiales.
The scatter distribution of the number of arsenic-related genes per genome grouped by the isolation sources. The isolation sources included human (H), plant (P), animal (Z), rhizosphere or root nodules (R), soil (S), sediment (D) and wastewater or sludge (W) (Table S1).

