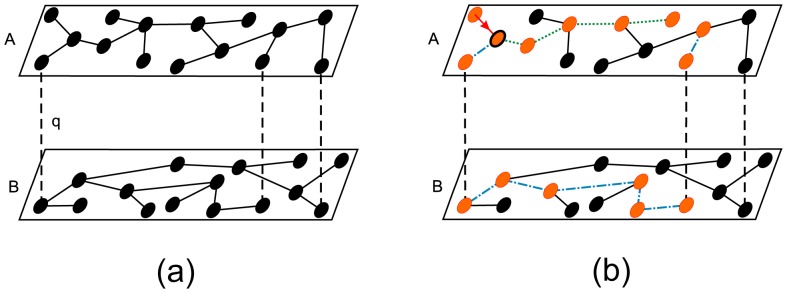
Figure 1. Scheme of a SIR epidemic process in a partially overlapped multiplex network.

Partially overlapped multiplex network with layer size  and fraction of shared nodes
  . The total size of the network is
  individuals. The dashed lines are used as a guide to show the fraction
  of shared nodes. (a) Before the spreading dynamics, all individuals are in the susceptible stage represented by black circles. (b) In the steady state of the epidemic, the recovered individuals are denoted by orange circles. The branches of infection start in the link denoted by a red arrow, which leads to an infected orange node denoted with a black contour. Two branches expand through the two available links of that node. One of the branches denoted by green dotted lines corresponds to a branch of infection that only spreads through layer A that is described by the first term of
  in Eq. (1). The other branch denoted in blue dash-dotted lines is a branch of infection that spreads through both layers and is described by the second term of
  in Eq. (1). An analogous interpretation holds for the terms of
  of Eq. (1).
