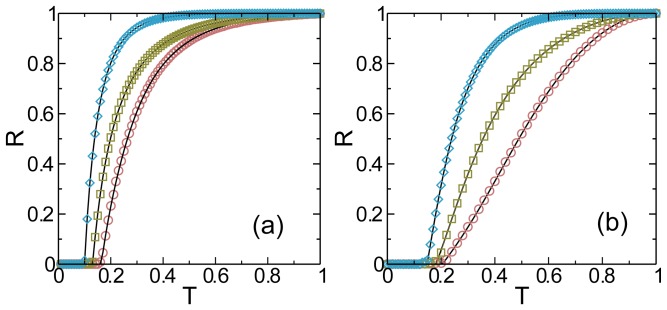
Figure 3. Theoretical predictions and simulations for the fraction of recovered individuals in the steady state of the epidemics.
Total fraction of recovered individuals in the steady state of the SIR model with  for (a) two Erdös-Rényi layers with
  and
and  and for (b) two power law layers with exponential cutoff
  with
with  and
and  , the minimum and maximum values of
  where set as
  and
and  , respectively, for both layers. In both panels full black lines correspond to theory given by Eq. (5) and simulations results are given for
  in pink circles,
  in green squares and
  in blue diamonds. All simulations were done with a total system size of
  and over
  realizations.

