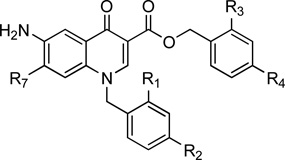
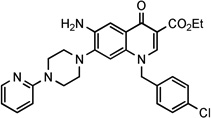
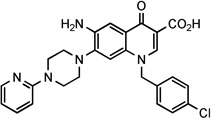
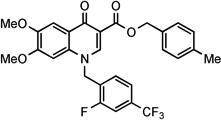
Table 1.
Estimated Ki values, inhibitory activity on NS5B, anti-HCV activity and cytotoxicity of the studied compounds
 | |||||||||||
|---|---|---|---|---|---|---|---|---|---|---|---|
| Cpds | R1 | R2 | R3 | R4 | R7 | AutoDock Estimated Ki |
NS5B functional assay |
Replicon assay on Huh5-2 | |||
| Ki (µM)a |
IC50 (µM)b |
EC50 (µM)c | EC90 (µM)d | CC50 (µM)e | SIf | ||||||
| 3 | F | CF3 | CH3 | H | Cl | 0.340 | 1.41±0.2 | 1.5 | NDg | 10.5 | 6.8 |
| 4 | F | CF3 | H | CH3 | Cl | 0.255 | 0.154±0.015 | 72.3 | >192.3 | >192.3 | >2.5 |
| 5 | H | Cl | H | Cl | Cl | 0.249 | NDg | >200 | >200 | >200 | NDg |
| 6 | H | Cl | H | Cl | 0.096 | 0.067±0.02 | 1.7 | NDg | 3.7 | 2.3 | |
| 7 | H | Cl | H | Cl | 0.070 | 0.040±0.004 | 2.7 | NDg | 2.8 | 1.2 | |
| 8 | H | Cl | H | Cl | 0.043 | 0.069±0.002 | 2.2 | 13.5 | >244 | >54 | |
| 9 | H | Cl | H | Cl | 0.093 | 0.138 ± 0.023 | 8.6 | NDg | >149 | >17 | |
| 10 | H | Cl | H | Cl |  |
0.178 | 6.132 ± 1.6 | 23.8 | 94.6 | >147 | >6 |
| 27 |  |
2.49 | 3.06± 0.6 | 31.3 | NDg | >193 | 3.06 | ||||
| 28 |  |
NCh | 23.7 ± 6 | 7.3 | NDg | >204 | >28 | ||||
| 2 |  |
0.652 | 0.211± 0.01 (0.008)i |
2.02 | 4.7 | 42.3 | 21 | ||||
AutoDock-predicted inhibition constant (Ki) for each selected IFD complex
IC50 = concentration of compound that inhibits 50% enzyme activity in vitro. The IC50 values of the compounds were determined from dose-response curves employing 8–12 concentrations of the indicated compounds in duplicate in two independent experiments ± SD.
EC50 = the effective concentration required to inhibit virus replication by 50%. The reported values represent the means of data derived at least from three independent experiments.
EC90 = the effective concentration required to inhibit virus replication by 90%. The reported value represents the means of data derived at least from three independent experiments.
CC50 = is the concentration of compound exhibiting 50% antimetabolic effect as evaluated by the MTS assay. The reported value represents the means of data derived at least from three independent experiments.
SI = selectivity index (ratio of CC50 to EC50).
ND = not determined.
NC= not calculated: the IFD top pose of this 6-aminoquinolone derivative showed that the compound was unable to properly occupy TSI.
IC50 value reported by Kumar et al.17
