
Figure 6.
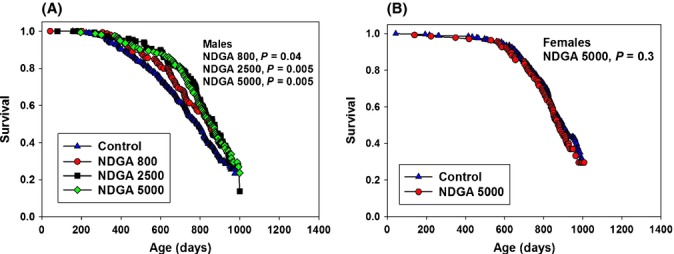
Survival curves comparing male controls and male mice fed NDGA at three different doses (A). Data for female controls and female mice fed the high dose of NDGA (B). Data were pooled from the three sites.
Official websites use .gov
A
.gov website belongs to an official
government organization in the United States.
Secure .gov websites use HTTPS
A lock (
) or https:// means you've safely
connected to the .gov website. Share sensitive
information only on official, secure websites.
Survival curves comparing male controls and male mice fed NDGA at three different doses (A). Data for female controls and female mice fed the high dose of NDGA (B). Data were pooled from the three sites.