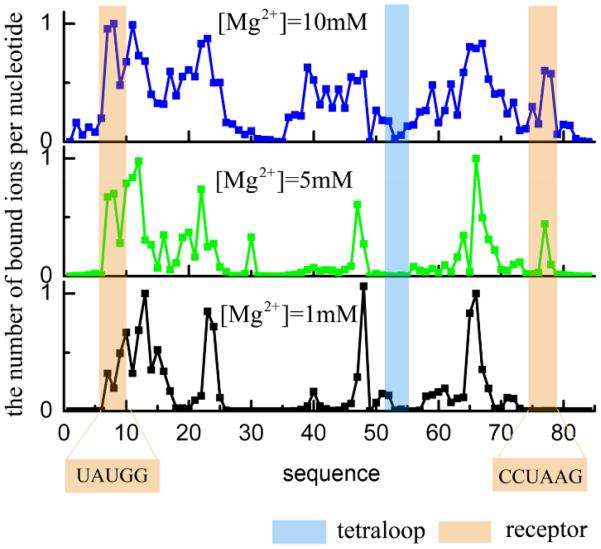
Figure 8.
The ion distribution for the lowest energy tetraloop-receptor structure (see Figs. 10b, c and d) in the different Mg2+ concentrations with 0.1M NaCl background at 37°C. The distribution is calculated as the Boltzmann average over all the possible ion binding models for the given RNA structure.

