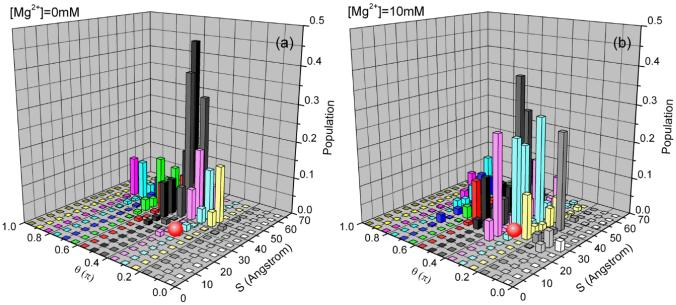
Figure 9.
The conformational distribution of the undocked state in the different Mg2+ concentrations with 0.1M NaCl background at 37°C. The calculation is based on the 4 sets independent Monte Carlo generated conformational ensembles. The figure shows the trend for the change of the populational distribution with increasing [Mg2+] according to the structural parameters S (x axis) and θ (y axis) (shown in Fig. 1). The docked state (the red ball) is shown for reference. To calculate the populational distribution, we first uniformly divide the conformational space into 30 clusters according to the distance S (see Fig. 1), we then uniformly divide each cluster into 30 sub-regions according to the angle θ (see Fig. 1). We calculate the average electrostatic free energy for the conformations in each subspace (S, θ) using the formula ΔGS,θ = (ΣiΔGi · e−ΔGi/kT)/(Σie−ΔGi/kT), where ΔGi is the free energy for the ith conformation in subspace (S, θ ). The z-axis in the figure shows the population of each subspace: P(S, θ) = exp[−(ΔGS,θ − ΔGmin)/kT], where ΔGmin is the minimum electrostatic free energy in the whole space.

