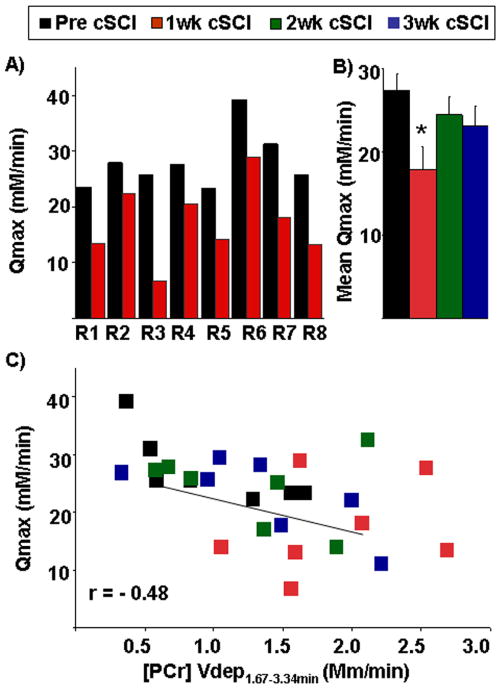
Fig IV.
A) Maximum oxidative ATP synthesis rate (Qmax) based on the [ADP] model before (pre cSCI) and after one week of spinal cord contusion injury (1wk cSCI) in individual rats (R1–R8). B) Mean maximum oxidative ATP synthesis rate (Qmax) based on the [ADP] model shows significant (*) declines (p=0.01) at 1wk cSCI as compared to pre cSCI and after two and three weeks post-cSCI (2wk cSCI and 3wk cSCI). C) Scatter-plot depicts relationship between the mean maximum oxidative ATP synthesis rate (Qmax) and rate of PCr depletion from 100–200s ([PCr] Vdep(1.67–3.34min)). Data of all animals (pre cSCI, 1wk cSCI, 2wk cSCI and 3wk cSCI) is pooled from each time point.

