
Figure 2. Intracerebral injection of NMO-IgG in rats produces NMO pathology.
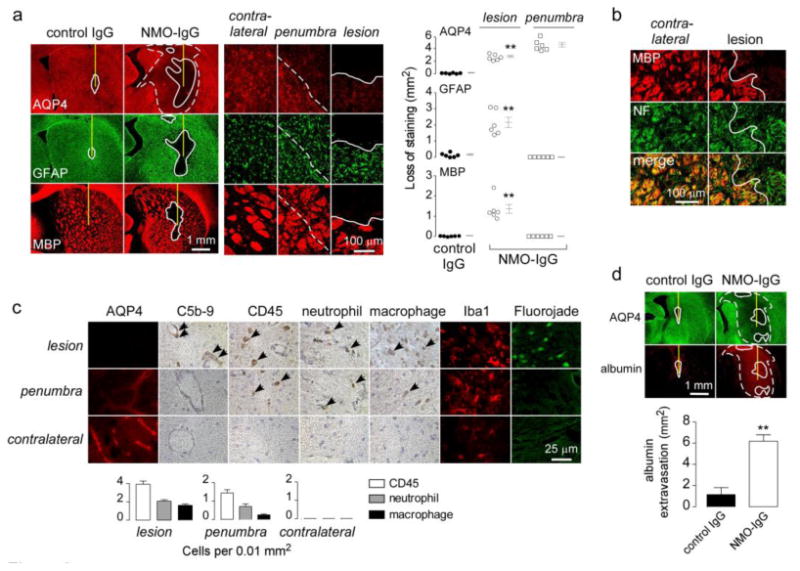
a. Brains were injected with 10 μg NMO-IgG or control IgG. (Left) AQP4, GFAP and MBP immunofluorescence at 5 days after injection. In this and subsequent figures the needle tract shown as a yellow line, white line demarcates region with loss of immunofluorescence, and white dashed line demarcates the penumbra (reduced AQP4 but normal GFAP and MBP immunofluorescence). (Middle) Higher magnification of indicated regions. (Right) Summary of lesion areas showing data for individual rats (S.E., n=6, ** P < 0.01). b. MBP and neurofilament [5] immunofluorescence. White line demarcates region with loss of immunofluorescence. c. (Left) Immunostaining for AQP4, activated complement (C5b-9), leukocytes (CD45), neutrophils (Ly6-G), macrophages (CD163), microglia (Iba1), and degenerating neurons (Fluorojade) in indicated regions. (Right) Number of infiltrating leukocytes per 0.01 mm2 (S.E., n=3). d. (Top) Albumin immunofluorescence. (Bottom) Area of albumin extravasation (S.E., n=3, ** P < 0.01).