
Figure 3. Characterization of early pathology and pathology produced by intracerebral injection of NMO patient serum.
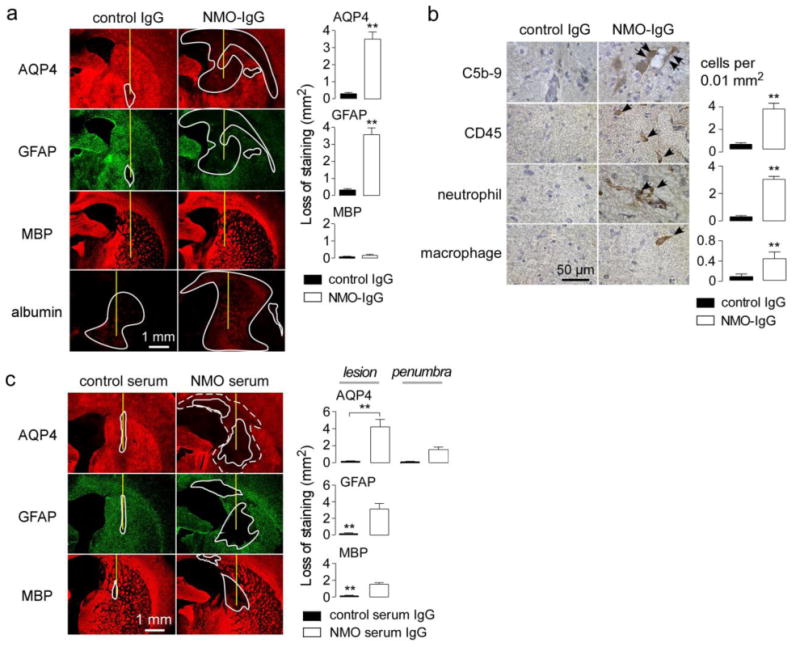
a. Brains were injected with 10 μg NMO-IgG or control IgG. (Left) AQP4, GFAP, MBP and albumin immunofluorescence at 1 day after injection. Needle track shown as yellow line and lesion demarcated by white line. (Right) Summary of lesion areas (S.E., n=3, ** P < 0.01). b. (Left) Immunohistochemistry in lesions from A. (Right) Number of infiltrating leukocytes per 0.01 mm2 (S.E., n=3). c. Brains were injected with 1 mg of purified IgG from NMO patient serum or control serum. (Left) AQP4, GFAP and MBP immunofluorescence at 5 days after injection. Summary of lesion areas (S.E., n=3, ** P < 0.01).