
Figure 6. Pathogenic role of macrophages in NMO.
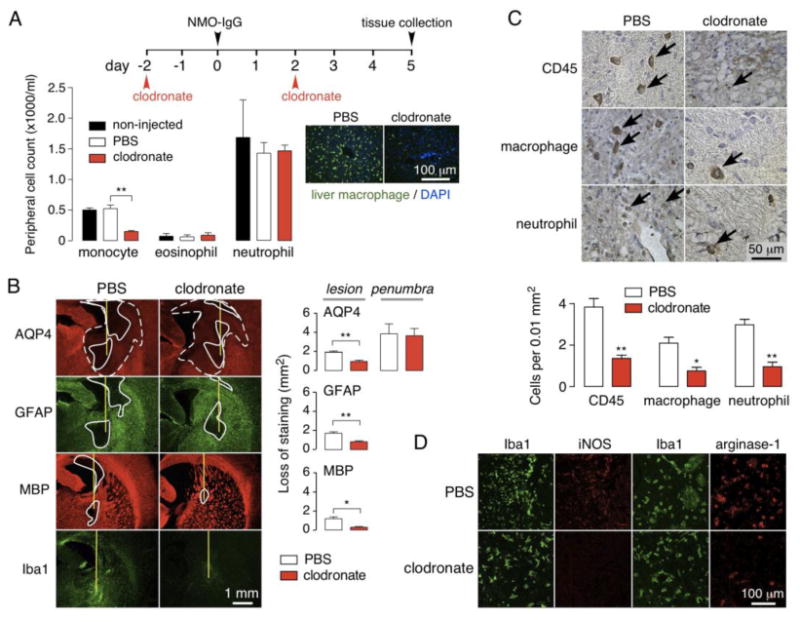
a. Macrophages were depleted by intraperitoneal injection of clodronate liposomes. (Left) Peripheral monocyte, eosinophil and neutrophil counts at day 5 in control (non-injected), and PBS-liposome and clodronate-liposome injected rats (S.E., n=3, ** P < 0.01). (Right) Liver sections immunostained for macrophages (green) with DAPI (blue) counterstain. b. AQP4, GFAP and MBP immunofluorescence at 5 days after intracerebral injection of 10 μg NMO-IgG in rat treated with control or clodronate liposomes. (Right) Summary of lesion areas (S.E., n=3, ** P < 0.01, * P < 0.05). c. (Top) Immunohistochemistry showing infiltrating leukocytes (arrows) in lesions. (Bottom) Number of CD45, CD163 and Ly-6G positive cells per 0.01 mm2 (S.E., n=3, ** P < 0.01, * P < 0.05). d. Iba1, M1 (M1 mac) and M2 (M2 mac) macrophage staining in rats treated with PBS- or clodronate-liposomes.