Abstract
Attention and awareness are two tightly coupled processes that have been the subject of the same enduring debate: Are they allocated in a discrete or in a graded fashion? Using the attentional blink paradigm and mixture modeling analysis, here we show that awareness arises at central stages of information processing in an ‘all-or-none’ manner: Manipulating the temporal delay between two targets affected the likelihood of consciously perceiving the second target, but did not affect the precision of this percept. Furthermore, these results held across stimulus categories and paradigms, and they were dependent on participants allocating attention to the first target. The findings distinguish the fundamental contributions of attention and awareness at central stages of visual cognition: Conscious perception emerges in a quantal manner, with attention serving to modulate the probability that representations reach awareness.
How do the stimuli that engage our sensory systems rise to the level of conscious perception (Baars, 2005)? Some models view awareness as graded, with the quality of a conscious percept reflecting the amount of sensory information and attention available (Bar et al., 2001, Overgaard et al., 2006; Nieuwenhuis & de Kleijn, 2011). Other models, by contrast, posit that while sensory information and attention may be graded, the resulting conscious percept is essentially discrete—either all or none (Vul et al., 2009; Dehaene et al., 2006; Quiroga et al., 2008).
This fundamental question has often revolved around the attentional blink (AB) paradigm (Raymond et al., 1992, Chun & Potter, 1995; Nieuwenstein et al., 2009), as it clearly implicates central attentional limits to conscious perception (Dux & Marois, 2009). The AB reflects the transient inability to consciously perceive the second of two targets (T2) in a rapid serial visual presentation (RSVP) of distractors when T2 is presented at short lags (200–400ms) after the first target (T1). At issue here is whether failures of T2 report occur because no information about that target reaches post-perceptual stages of information processing, or whether the information is degraded when it reaches those stages, thus producing an inaccurate or impoverished conscious representation. Because standard AB tasks measure discrimination or detection accuracy, they cannot distinguish between these possibilities. To overcome this limitation, recent studies have relied either on probabilistic inferences of discrete responses (Vul et al., 2009) or on subjective judgments to determine whether target perception is all-or-none (Sergent & Dehaene, 2004). However, such indirect subjective methods, which involve subjects introspecting about how clearly they perceive a target or how confident they are about their perceptual decisions, may be unreliable (Hannula et al., 2005; Seth et al., 2008; Clifford et al., 2008). Moreover, their use has yielded conflicting results, with evidence both for (Sergent & Dehaene, 2004; Vul et al., 2009) and against (Overgaard et al., 2006; Nieuwenhuis & de Kleijn, 2011) quantal perception in the AB.
To address the issue of whether conscious perception in the AB is discrete, here we used a direct and continuous perceptual measure: Subjects reported the quality of their T2 representations by selecting a value along a circular dimension of the target feature (e.g. color), after which we examined the error distribution of these responses. On trials in which T2 is consciously perceived, a participant’s errors will be distributed around the correct value, with the width of the error distribution corresponding to the quality of the T2 percept (narrower distributions imply more precise information). The responses on trials in which T2 is not perceived will be random and uncorrelated with the correct value, producing a uniform distribution of response error. The observed report error distribution can thus be modeled as a mixture of these two component distributions in order to measure the probability of encoding T2 (Pe) and the quality with which T2 is perceived (standard deviation, σ) (Zhang & Luck, 2008; Bays & Hussein, 2009; Fougnie et al., 2010, Anderson & Awh, 2012). If awareness of T2 is all-or-none, then the effect of lag between T1 and T2 should affect the probability that the target is perceived, but not its precision. By contrast, if awareness emerges in a graded manner, then an increasingly precise perception of the target should be established with longer T1–T2 delays.
Experiment 1: Color AB Task
Method
Participants
Twenty-eight subjects (13 males, ages 18–28) from the Vanderbilt University community participated in this study after giving informed consent. The Vanderbilt IRB approved the protocol for this and all subsequent experiments. The data from four additional subjects were removed owing to at-chance T1 performance (3) or extremely poor T2 performance (1).
Stimuli and Procedure
The task consisted of reporting the color of two squares presented in an RSVP of colored circles (Fig. 1). A trial began with a centrally-presented fixation dot (0.35° × 0.35°) followed by an RSVP of 12–27 colored disks (2.2° across). Two square targets were embedded in the RSVP stream (Fig. 1A). T1 was either black or white and appeared at serial position 8, 10, 12 or 14. T2 was one of 180 equiluminant colors (drawn from CIE L*a*b* color space, centered at L = 54, a = 18, b = −8, with a radius of 59) and appeared 1, 2, 4, or 8 serial positions (lags) after T1. T2 was always followed by three distractors to terminate the RSVP stream. Subjects reported the color of T2 by moving the mouse to select one of 180 colors displayed along a ‘color wheel’ (6.5° radius, 1.1° wide; Fig. 1B). Feedback (error in degrees) was displayed for 500 ms. Subjects then indicated whether T1 was white or black via a keypress. Responses were not time-restricted.
Figure 1.
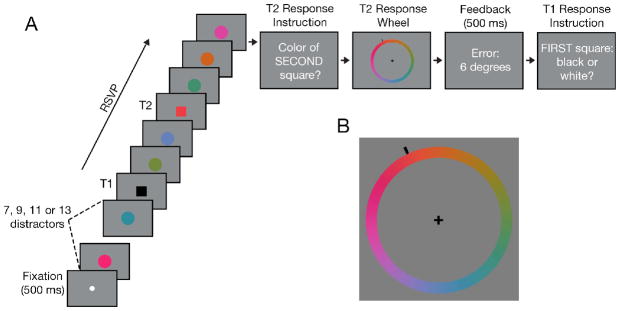
Experimental paradigm of the color AB task (Experiment 1). A) Subjects reported the color of two square targets (Black or white for T1, any of the 180 equiluminant colors for T2). B) At the conclusion of each trial, subjects reported T2’s color via a color wheel before making their T1 response.
Each subject completed 160 trials in each of four blocks. Prior to the experiment, subjects performed eight practice trials, with the first two having a stimulus frame duration of 190 ms. The frame duration for subsequent trials was adjusted to maintain T2 performance near 60% at lags 1–2 (average frame duration = 115 ± 10 ms). After every eighth trial, the frame duration was adjusted (+/− ≤ 20ms) based on the number of T2 responses within 45 degrees of their respective targets.
Analysis
Response error values for the T2 task were calculated for each trial as the deviation between the target’s true color value and the participant’s response. Errors were modeled as a weighted mixture of two distributions, with guess responses drawn from a uniform distribution and non-guess responses drawn from a circular normal distribution defined by its mean (μ, a measure of bias) and concentration (k, a measure of spread, converted to standard deviation, σ; Zhang & Luck, 2008). The mixture parameter (relative weight of the circular normal distribution) reflects the probability of encoding T2 (Pe). The parameter values for each participant and condition were computed using maximum likelihood estimation.
As is typical in AB studies, only T2 trials in which T1 was correct (T2|T1) were analyzed. Except for a slight (2º) response bias (μ) at lag 1 in Experiment 1, no response bias was detected across all experiments. Conventional parametric statistical tests were used to assess the effects of lag on precision and probability of encoding. The strengths of evidence for key null effects reported in this and the following experiments were also estimated using Bayes factors analysis (Supplementary Analysis: Bayes factors).
Finally, we ensured that a typical AB was observed when using a standard T2 probe instead of the continuous report (see Supplementary Experiment 1).
Results
A one-way, within-subjects ANOVA revealed that the probability of encoding T2 (Pe) was sharply affected by lag (F3,81 = 19.85, p < 0.001). The timecourse of encoding performance was consistent with the presence of an AB (Fig. 2B). A post-hoc t-test between the diagnostic AB lag (lag 2) and a long lag (lag 8) revealed lower Pe at lag 2 (t27 = 7.29, p < 0.001; see Fig. 3 for aggregated data). Moreover, Pe was higher at lag 1 than at lag 2 (t27 = 2.94, p < 0.01), a well-characterized feature of the AB known as lag-1 sparing (Raymond et al., 1992; Visser et al., 1999). Unlike Pe, however, the precision of encoded T2s was barely affected by lag (F3,81 = 2.27, p = 0.09). Importantly, that marginal effect cannot account for the AB, as σ was no less precise at lag 2 than at lag 8 (t27 = 0.34, p = 0.73). Instead, the marginal effect appears to be driven by higher σ at lag 1 than lag 2 (t27 = 1.87, p = 0.07), perhaps because T1’s high contrast affected T2 precision. A follow-up experiment ruled out the possibility that T2 perception was too impoverished to observe effects on precision, as the same pattern of results was obtained even when Pe was above 80% at short lags (see Supplementary Experiment 2).
Figure 2.
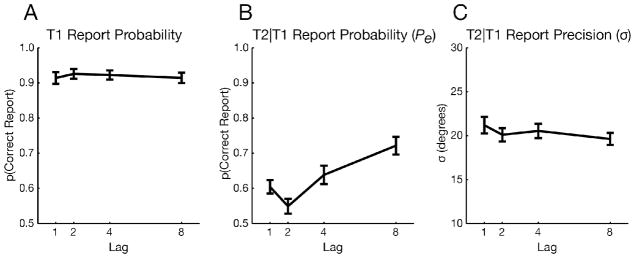
Results of the color AB task (Experiment 1). A) T1 results showing no effect of lag. B) Probability (Pe) of T2 encoding. C) Precision (σ) of T2 encoding, where lower σ values (standard deviation of report error) correspond to better precision. Error bars reflect standard error of the mean (SEM).
Figure 3.
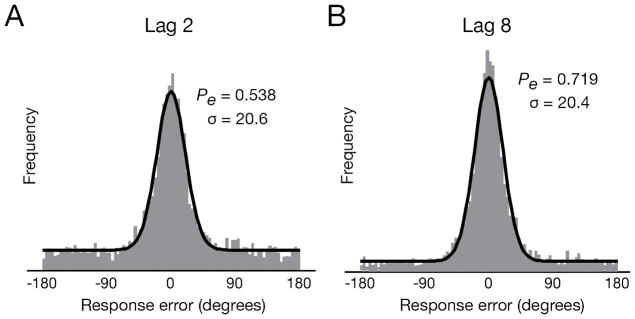
Mixture model example. Response error distributions aggregated across all participants for lags 2 and 8. Each distribution was modeled (black line) as a mixture of a distribution for target responses (circular Gaussian) and one for random guesses (uniform).
Experiment 2: Face AB
Does discrete conscious perception generalize across stimulus classes and AB paradigms? Color stimuli contain little information and can be fully encoded in 50 ms (Vogel et al., 2006; Todd et al., 2011). It is possible that lag effects on target precision emerge only when stimuli are presented too briefly to be fully encoded, thereby leaving room for attention to increase the amount of information that is extracted from T2. In addition, the results of Experiment 1 may be tied to the structure of the employed task, in which the target feature to be reported (color) was distinct from that used to identify T2 (shape).
To address these issues, Experiment 2 used faces as targets, as these are complex stimuli that take several hundred milliseconds to be fully encoded (Eng et al., 2005; Curby & Gauthier, 2007; Todd et al., 2011). Furthermore, instead of an RSVP design, we used a skeletal AB paradigm (Ward et al., 1996): Only the two face targets followed by their respective masks were presented, allowing for straightforward selection of the T2 stimulus (Fig. 4). Two parameters were manipulated across trials: the stimulus onset asynchrony (SOA) of targets, either short (200 ms) or long (800 ms), and the duration of T2 presentation, either 100 or 200 ms. The latter manipulation provided a built-in control for assessing the sensitivity of the mixture modeling analysis to detect changes in precision, as variations in stimulus durations modulate the amount of information extracted (e.g. Todd et al., 2011). Moreover, as AB effects are attenuated at longer stimulus durations (Reeves & Sperling, 1986), one would expect a much weaker AB with the 200 ms stimulus duration.
Figure 4.
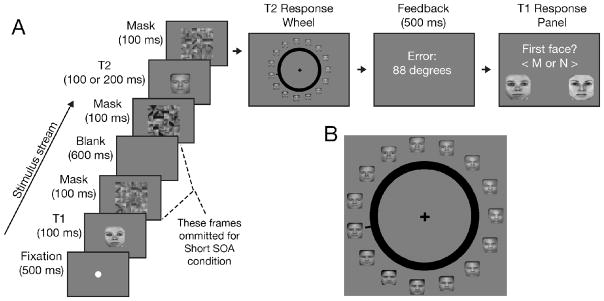
Face AB experimental design (Experiment 2). A) Two masked faces were sequentially presented either with a short (200 ms) or long (800 ms) SOA. B) Subjects reported T2’s identity via a face wheel.
Method
Participants
There were 16 subjects (6 males, ages 19–28 years). Four additional participants were excluded because their T1 performance was at chance (2) or their T2 report accuracy was too low (Pe < 10%) to calculate reliable precision estimates (Anderson & Awh, 2012).
Stimuli and Procedures
Each trial consisted of the serial presentation of two masked face targets for subsequent report. T1 was one of two female faces (4.2º × 4.2º), T2 was a morphed face chosen from a set of 150 (Fig. 4A), and the masks were mosaic scrambles of the morphed faces. To construct the morphed faces, three highly distinct male faces were chosen as anchors and a linear progression of 49 morphs was constructed between each pair of anchor faces using Norkross MorphX. Each face subtended 4.2 × 4.2º when presented as T2 targets. Scrambled faces (6.3º × 6.3º) were created by dividing a given morphed face into 16 tiles, and randomly shuffling the tiles with replacement to form a 6×6 grid.
A trial began with the presentation of a fixation dot, followed by T1 (100 ms), and then a scrambled face (100 ms) that served as a backwards mask (Figure 4A). In the short SOA condition (200 ms), T2 and its mask immediately followed T1’s mask. In the long (800 ms) SOA condition, scrambled faces immediately preceded and followed T2. These sequences ensured that T2 was equally masked across both SOA conditions because the T1 backward mask in the short SOA condition also served as a forward mask for T2. The SOA and T2 duration manipulations were fully crossed. To prevent subjects from focusing on specific locations of each face, each stimulus’ position was jittered by up to 0.7º.
A probe “face wheel” appeared 210 ms after T2 mask presentation. Fifteen 2.0 × 2.0º faces (equally separated in physical and morph space used to create the stimuli) appeared around the 11.9º wheel (Fig. 4B). Subjects used a mouse to move a black indicator until it pointed to the perceived T2 face or a mental interpolation between two adjacent faces. Feedback on the response error (in degrees) was provided for 500 ms. After the T2 response, a display asking ‘First Face?’ prompted subjects to indicate by button press which of the two female faces had been presented as T1. Subjects practiced on eight trials before completing four blocks of 160 trials each.
Supplementary Experiment 3 confirmed that a regular AB could be observed with the skeletal design with face stimuli, while Supplementary Experiment 4 confirmed that these effects were largely due to attention to T1.
Results
Pe and σ for T2 were each submitted to a two-way, within-subjects ANOVA with factors of SOA and T2 duration. Pe was markedly reduced when the SOA and T2 duration were both short (Fig. 5B; SOA x T2 duration interaction: F1,15 = 13.82, p = 0.002), which are optimal conditions for observing an AB.
Figure 5.
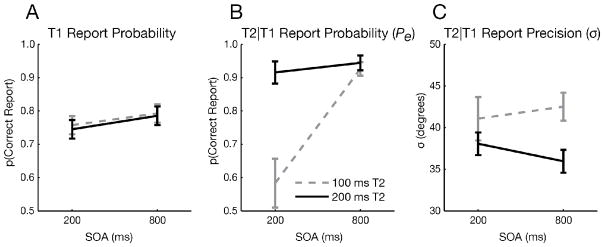
Face AB experiment results. A) T1 results showing only a small effect of SOA (F1,15 = 16.22, p = 0.001). B) Probability (Pe) and C) precision (σ) of T2 report for the 200 ms and 800 ms SOAs. Faces were presented for 100 ms (gray dashed lines) or 200 ms (black solid lines). Error bars reflect SEM.
In contrast to the effects on Pe, precision (indexed by σ) was neither affected by SOA (Fig. 5C; F1,15 = 0.02, p = 0.88), nor did it exhibit an interaction between SOA and T2 duration (F1,15 = 0.70, p = 0.41). Importantly, precision was strongly modulated by T2 duration (F1,15 = 11.11, p = 0.005), indicating that the mixture modeling analysis was sensitive to the precision at which a stimulus is encoded; doubling the T2 face duration should allow more information to be extracted, yielding a more veridical face representation (Todd et al., 2011).
Consistent with Experiment 1’s results, these findings suggest that the deficit in conscious target perception results solely from a change in the probability of encoding targets rather than a modulation of the precision of target representations.
Discussion & Conclusions
Across both stimulus classes (colors and faces) and experimental designs (RSVP and skeletal), we showed that the reported precision of a target item is not affected in the AB, even though our paradigms had the sensitivity to detect such effects. Moreover, when we fit the data with an alternative “variable precision” model that assumes that guesses are just targets encoded at very low precision (van den Berg et al., 2012; see also Fougnie et al., 2012), we found that our original model with distinct guess and precision parameters better accounted for the data (Supplementary Analysis: Variable precision model). Finally, whereas precision judgments were made on the basis of consciously reported targets, guesses were not (Supplementary Experiment 5). Although we cannot exclude the possibility that non-reported targets reached awareness but were immediately forgotten, together these results clearly support the hypothesis that conscious perception, at least at central stages of information processing, is all-or-none (Sergent & Dehaene, 2004; Dehaene et al., 2006).
Given that the AB results from the costs of attentional deployment to T1 (Dux & Marois, 2009; Supplementary Experiment 4), our findings also indicate that attention modulates the probability of a quantal episode of conscious perception. This account, however, does not rule out qualitative attentional effects at earlier stages of visual information processing (e.g. perceived contrast; Liu et al., 2009; Reynolds & Chelazzi, 2004). Instead, it suggests that under conditions in which stimuli compete for representation at post-perceptual stages of information processing, attention regulates the probability of all-or-none conscious representations of task-relevant events without affecting the precision of these representations.
Acknowledgments
This work was supported by an NIMH grant RO1 MH70776 to R.M. and a P30-EY008126 grant to the VVRC. We thank Ellie Conser for experimental assistance.
References
- Anderson DE, Awh E. The plateau in mnemonic resolution across large set sizes indicates discrete resource limits in visual working memory. Attention, Perception, & Psychophysics. 2012;74(5):891–910. doi: 10.3758/s13414-012-0292-1. [DOI] [PMC free article] [PubMed] [Google Scholar] [Retracted]
- Baars BJ. Global workspace theory of consciousness: toward a cognitive neuroscience of human experience. Progress in Brain Research. 2005;150:45–53. doi: 10.1016/S0079-6123(05)50004-9. [DOI] [PubMed] [Google Scholar]
- Bar M, Tootell RB, Schacter DL, Greve DN, Fischl B, Mendola JD, Rosen BR, Dale AM. Cortical mechanisms specific to explicit visual object recognition. Neuron. 2001;29(2):529–35. doi: 10.1016/s0896-6273(01)00224-0. [DOI] [PubMed] [Google Scholar]
- Bays PM, Catalao RF, Husain M. The precision of visual working memory is set by allocation of a shared resource. Journal of Vision. 2009;9(10):7, 1–11. doi: 10.1167/9.10.7. [DOI] [PMC free article] [PubMed] [Google Scholar]
- Chun MM, Potter MC. A two-stage model for multiple target detection in rapid serial visual presentation. Journal of Experimental Psychology: Human Perception & Performance. 1995;21(1):109–27. doi: 10.1037//0096-1523.21.1.109. [DOI] [PubMed] [Google Scholar]
- Clifford CWG, Arabzadeh E, Harris JA. Getting technical about awareness. Trends in Cognitive Sciences. 2008;12(2):54–58. doi: 10.1016/j.tics.2007.11.009. [DOI] [PubMed] [Google Scholar]
- Curby KM, Gauthier I. A visual short-term memory advantage for faces. Psychonomic Bulletin & Review. 2007;14(4):620–8. doi: 10.3758/bf03196811. [DOI] [PubMed] [Google Scholar]
- Dehaene S, Changeux JP, Naccache L, Sackur J, Sergent C. Conscious, preconscious, and subliminal processing: a testable taxonomy. Trends in Cognitive Sciences. 2006;10(5):204–11. doi: 10.1016/j.tics.2006.03.007. [DOI] [PubMed] [Google Scholar]
- Dux PE, Marois R. The attentional blink: a review of data and theory. Attention, Perception, & Psychophysics. 2009;71(8):1683–700. doi: 10.3758/APP.71.8.1683. [DOI] [PMC free article] [PubMed] [Google Scholar]
- Eng HY, Chen D, Jiang Y. Visual working memory for simple and complex visual stimuli. Psychonomic Bulletin & Review. 2005;12(6):1127–33. doi: 10.3758/bf03206454. [DOI] [PubMed] [Google Scholar]
- Fougnie D, Asplund CL, Marois R. What are the units of storage in visual working memory? Journal of Vision. 2010;10(12):27. doi: 10.1167/10.12.27. [DOI] [PMC free article] [PubMed] [Google Scholar]
- Fougnie D, Suchow JW, Alvarez GA. Variability in the quality of visual working memory. Nature Communications. 2012;3:1229. doi: 10.1038/ncomms2237. [DOI] [PMC free article] [PubMed] [Google Scholar]
- Hannula DE, Simons DJ, Cohen NJ. Imaging implicit perception: promise and pitfalls. Nature Reviews Neuroscience. 2005;6(3):247–55. doi: 10.1038/nrn1630. [DOI] [PubMed] [Google Scholar]
- Liu T, Abrams J, Carrasco M. Voluntary attention enhances contrast appearance. Psychological Science. 2009;20(3):354–62. doi: 10.1111/j.1467-9280.2009.02300.x. [DOI] [PMC free article] [PubMed] [Google Scholar]
- Nieuwenhuis S, de Kleijn R. Consciousness of targets during the attentional blink: a gradual or all-or-none dimension? Attention, Perception, & Psychophysics. 2011;73(2):364–73. doi: 10.3758/s13414-010-0026-1. [DOI] [PMC free article] [PubMed] [Google Scholar]
- Nieuwenstein M, Van der Burg E, Theeuwes J, Wyble B, Potter M. Temporal constraints on conscious vision: on the ubiquitous nature of the attentional blink. Journal of Vision. 2009;9(9):18, 1–14. doi: 10.1167/9.9.18. [DOI] [PubMed] [Google Scholar]
- Overgaard M, Rote J, Mouridsen K, Ramsøy TZ. Is conscious perception gradual or dichotomous? A comparison of report methodologies during a visual task. Consciousness and Cognition. 2006;15(4):700–8. doi: 10.1016/j.concog.2006.04.002. [DOI] [PubMed] [Google Scholar]
- Quiroga RQ, Mukamel R, Isham EA, Malach R, Fried I. Human single-neuron responses at the threshold of conscious recognition. Proceedings of the National Academy of Sciences of the United States of America. 2008;105(9):3599–604. doi: 10.1073/pnas.0707043105. [DOI] [PMC free article] [PubMed] [Google Scholar]
- Raymond JE, Shapiro KL, Arnell KM. Temporary suppression of visual processing in an RSVP task: an attentional blink? Journal of Experimental Psychology: Human Perception & Performance. 1992;18(3):849–60. doi: 10.1037//0096-1523.18.3.849. [DOI] [PubMed] [Google Scholar]
- Reeves A, Sperling G. Attention gating in short-term visual memory. Psychological Review. 1986;93(2):180–206. [PubMed] [Google Scholar]
- Reynolds JH, Chelazzi L. Attentional modulation of visual processing. Annual Review of Neuroscience. 2004;27:611–47. doi: 10.1146/annurev.neuro.26.041002.131039. [DOI] [PubMed] [Google Scholar]
- Sergent C, Dehaene S. Is consciousness a gradual phenomenon? Evidence for an all-or-none bifurcation during the attentional blink. Psychological Science. 2004;15(11):720–8. doi: 10.1111/j.0956-7976.2004.00748.x. [DOI] [PubMed] [Google Scholar]
- Seth AK, Dienes Z, Cleeremans A, Overgaard M, Pessoa L. Measuring consciousness: relating behavioural and neurophysiological approaches. Trends in Cognitive Sciences. 2008;12(8):314–21. doi: 10.1016/j.tics.2008.04.008. [DOI] [PMC free article] [PubMed] [Google Scholar]
- Todd JJ, Han SW, Harrison S, Marois R. The neural correlates of visual working memory encoding: a time-resolved fMRI study. Neuropsychologia. 2011;49(6):1527–36. doi: 10.1016/j.neuropsychologia.2011.01.040. [DOI] [PMC free article] [PubMed] [Google Scholar]
- van den Berg R, Shin H, Chou WC, George R, Ma WJ. Variability in encoding precision accounts for visual short-term memory limitations. Proceedings of the National Academy of Sciences USA. 2012;109(22):8780–8785. doi: 10.1073/pnas.1117465109. [DOI] [PMC free article] [PubMed] [Google Scholar]
- Visser TA, Zuvic SM, Bischof WF, Di Lollo V. The attentional blink with targets in different spatial locations. Psychonomic Bulletin & Review. 1999;6(3):432–6. doi: 10.3758/bf03210831. [DOI] [PubMed] [Google Scholar]
- Vogel EK, Woodman GF, Luck SJ. The time course of consolidation in visual working memory. Journal of Experimental Psychology: Human Perception & Performance. 2006;32(6):1436–1451. doi: 10.1037/0096-1523.32.6.1436. [DOI] [PubMed] [Google Scholar]
- Vul E, Hanus D, Kanwisher N. Attention as inference: selection is probabilistic; responses are all-or-none samples. Journal of Experimental Psychology: General. 2009;138(4):546–60. doi: 10.1037/a0017352. [DOI] [PMC free article] [PubMed] [Google Scholar]
- Ward R, Duncan J, Shapiro K. The slow time-course of visual attention. Cognitive Psychology. 1996;30(1):79–109. doi: 10.1006/cogp.1996.0003. [DOI] [PubMed] [Google Scholar]
- Zhang W, Luck SJ. Discrete fixed-resolution representations in visual working memory. Nature. 2008;453(7192):233–5. doi: 10.1038/nature06860. [DOI] [PMC free article] [PubMed] [Google Scholar]


