
Figure 5.
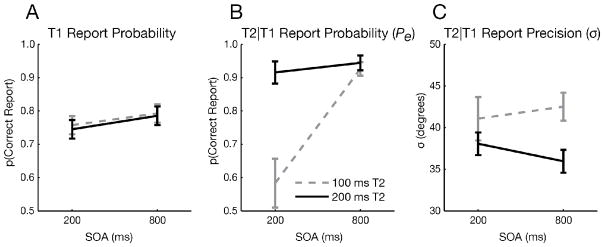
Face AB experiment results. A) T1 results showing only a small effect of SOA (F1,15 = 16.22, p = 0.001). B) Probability (Pe) and C) precision (σ) of T2 report for the 200 ms and 800 ms SOAs. Faces were presented for 100 ms (gray dashed lines) or 200 ms (black solid lines). Error bars reflect SEM.