
Figure 1.
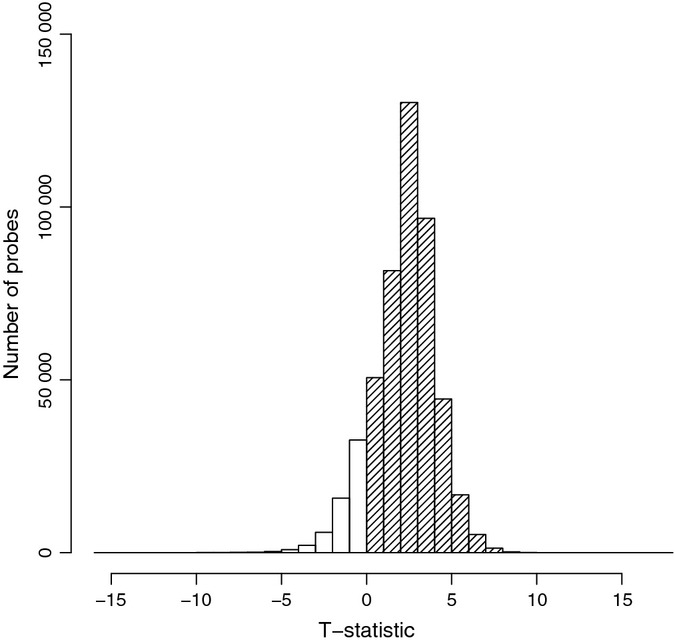
Changes in methylation status with age. Distribution of the t-statistic shows a significant hypermethylation of DNA derived from skeletal muscle of older versus younger adults (distribution is shifted to the right). Y-axis: number of CpG probes; x-axis: t-statistic. Filled columns are hypermethylated with age, and uncolored columns hypomethylated with age.