
Figure 2.
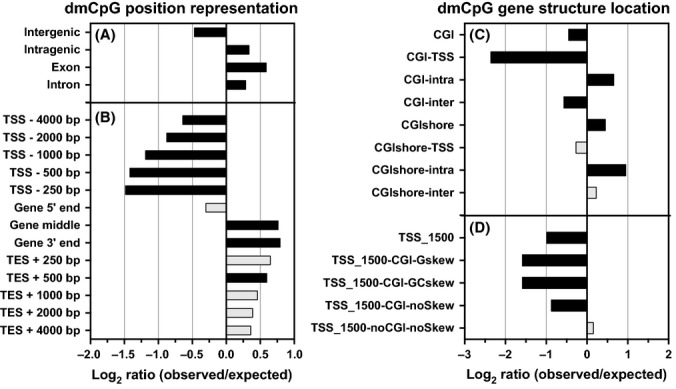
Distribution of dmCpG. Log(2) ratio of observed [fraction of dmCpG from all CpG sites on the microarrays (aCpG) in a region] to expected (fraction of dmCpG from aCpG in genome) for a region. Black color indicates a significant overrepresentation (P < 0.05) of dmCpG. The positional categories of dmCpG contain the location of dmCpG sites in relation to specific sequence features in the genome. The number following TSS/TES refers to the number of nucleotides upstream and downstream of TSS/TES. A detailed regional description and the breakdown of the hyper- and hypomethylated site observed/expected ratios can be found in Table S12 (Supporting Information) and Table S2.