
Figure 4.
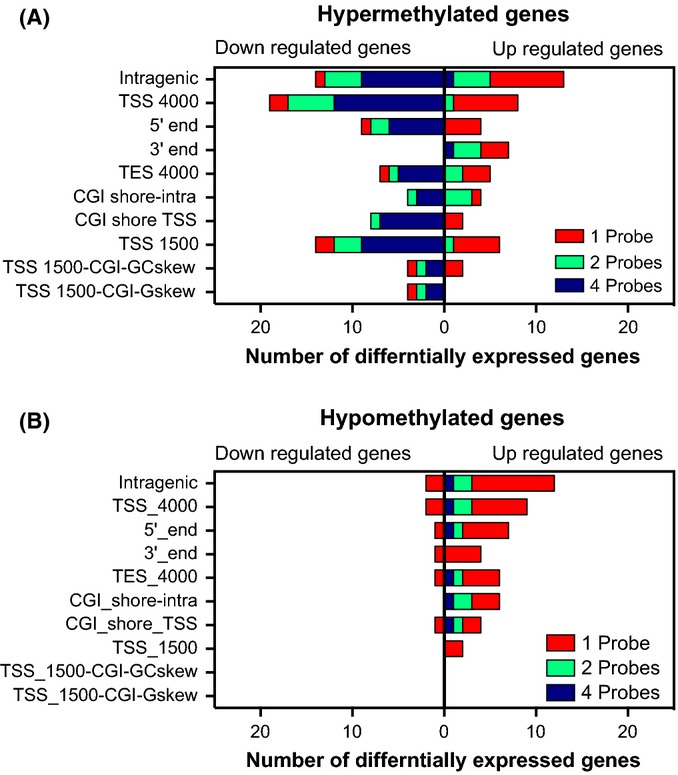
Correspondence of hyper- and hypo-dmCpG in genes with changes in gene expression. Number of genes (x-axis) that have a minimal number of hypermethylated (A) or hypomethylated dmCpG (B). The data are displayed as a stacked bar chart for one probe (red), two probes (green), or four probes (blue) for each genome position category. The expression change in aged tissue is indicated as bars. Left of axis is down-regulated and bars to the right are up-regulated. Detailed description of genome position categories is described in Table S12.