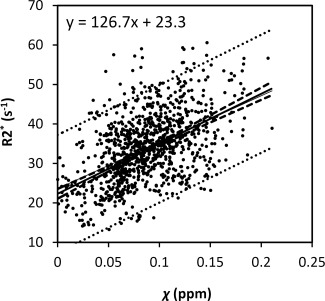
Figure 6.

Relationship between R2* and magnetic susceptibility in gray‐matter nuclei. The R2* and susceptibility relationship were fitted with a linear model. The dashed and dotted lines represent the functional and observation bounds of 95% confidence.
